The West-East ebb and flood of gold
Jan Nieuwenhuijs
Gold Analyst
Introduction
The West-East ebb and flood pattern holds that physical gold migrates from the West to the East when the gold price declines and from the East to the West when the price of gold rises. What causes this pattern is that gold trades more like a currency than a commodity and that in the past decades, the West has mainly set the price. Cultural differences between West and East can explain the pattern.
For this article, the West comprises Europe and the US, having its predominant trading and storage centers in the UK (London) and Switzerland. The East comprises the Middle-East, India, China and South-East Asia, having its most important trading hubs in the UAE (Dubai) and Hong Kong. I will categorise the rest of the world as “ROW”.
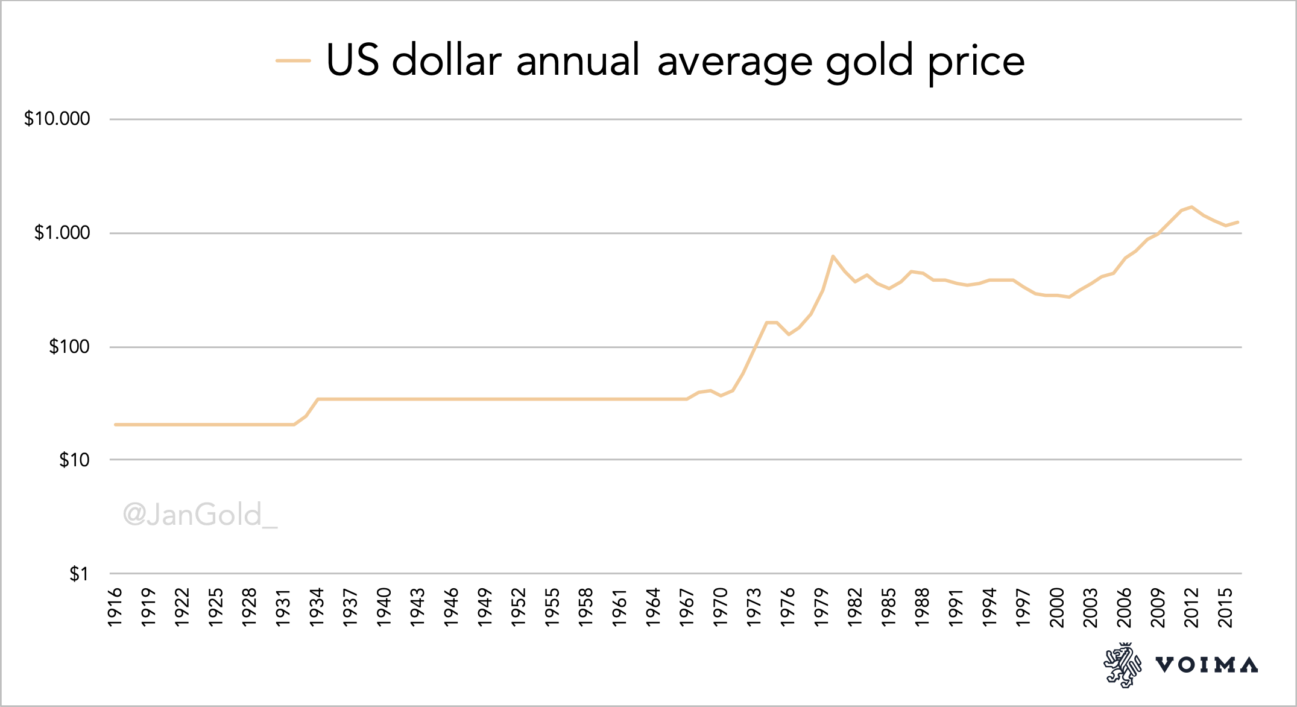
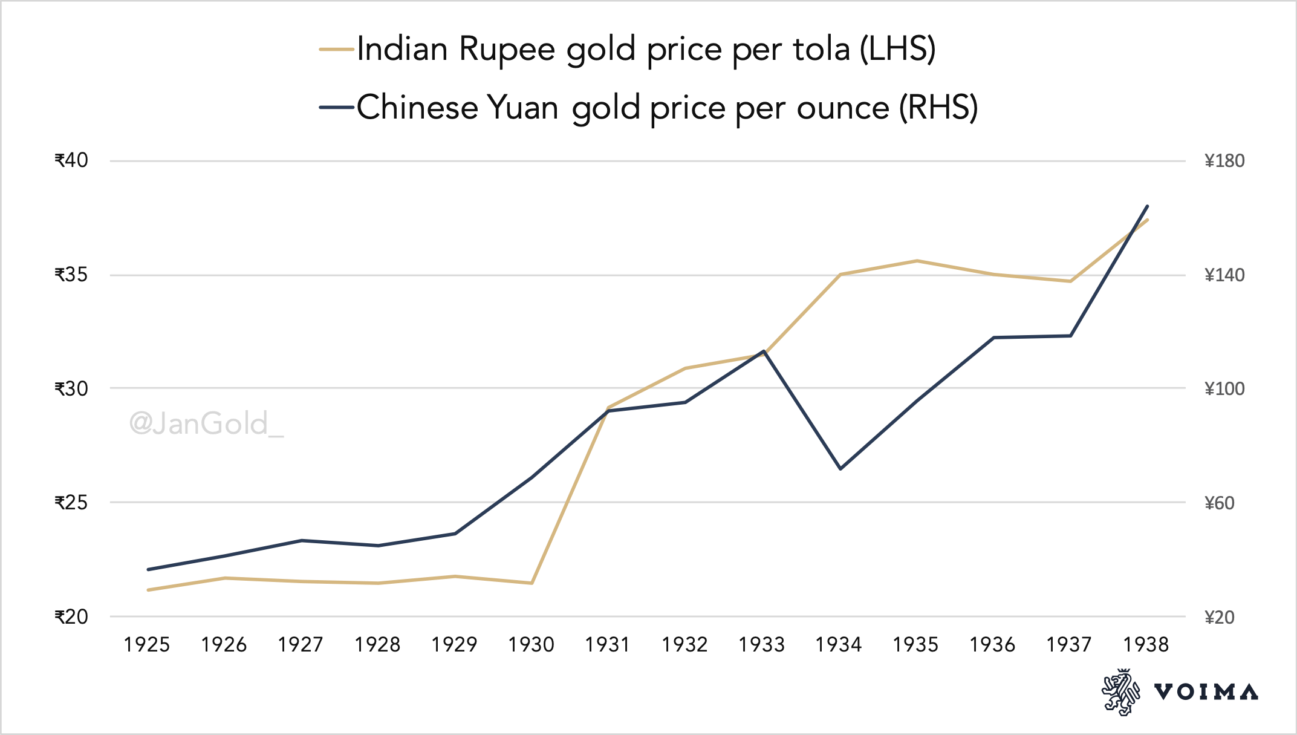
But first, have a look at the next graph showing the development of the gold price in the past 100 years, to get a rough idea of when gold bull and bear markets occurred.
The ebb and flood pattern of gold
The ebb and flood pattern of gold is the movement of physical gold from the West to the East when the gold price declines, the West causing the price to fall, and the movement of gold from the East to West when the price of gold rises, the West causing the price to rise. Not every cross-border gold trade fits the ebb and flood pattern, but on numerous occasions, we can clearly identify the trend. And once the pattern is revealed, one is offered a clearer understanding of the gold market.
The ebb and flood of gold is not a phrase coined by me. It was conceived by the famous gold author Timothy Green in his book The Prospect for Gold: The View to the Year 2000, published in 1987, although he wrote about elements of the pattern in his previous books. Let us read a few quotes from The Prospect for Gold, to get acquainted with the reasoning behind the ebb and flood pattern.
The Mood Of The Souks
Over the last twenty years, close to 8,000 tonnes of gold, … has been absorbed in a broad sweep of countries from Morocco along the North African coast to Egypt, Turkey, Saudi Arabia and the Gulf, the Indian sub-continent and South-East Asia. This off-take includes 18-carat gold jewellery…, 22 carat … jewellery, coins made in local factories …, kilo bars and a wonderful range of small bars (tael bars for Hong Kong and Taiwan, baht bars for Bangkok and ‘Fortunas' for the Middle East). They are sold on very low mark-ups over the gold price of the day, and represent the basic form of saving for millions of people in countries where banking systems, savings schemes and stock markets are not available (or are not trusted).
Substantial amounts often change hands at marriage. In India five tolas (…just under 2 ounces) is still commonplace. In Morocco the bride will be adorned in a golden belt that may weigh anything from 200-300 grams to 1 kilo. In Saudi Arabia many brides are decked with a duru, a lace-like embroidery of gold chain interwoven with small coins that often weighs over a kilo. At the modern factory of Saudi Gold outside Riyadh I saw one spectacular duru weighing 5 kilos which would drape the bride, like a cascade of light golden armour, from her neck almost to her knees. Such jewellery is purchased on a mark-up of only ten to twenty per cent over the gold price of the day. Consequently, a modest rise in the gold price produces a profit, and many women will trade in a few bangles, just as an investor takes his profit on a stock market peak. Equally, if they have cash and the price is low, they will buy more, gathering in the shops in the souk in the for a social outing. They buy bracelets of 50 grams or 100 grams, often adorned with locally made sovereigns or half-sovereigns. Their husbands, meanwhile, will buy kilo bars when business is good (and the price low) and sell them at a profit if it rises …
The Prospect for Gold, p. 133
Many regional markets of the Middle-East and South-East Asia have shown remarkable sensitivity to sudden price movements. They go into reverse virtually overnight if the price soars and start dishoarding gold back to London or Zurich, often in significant amounts.
The Prospect for Gold, p. 3
Selling gold is not a one-way street, …The physical gold market can go into reverse overnight, demanding that the investor absorbs not just conventional supplies, but dishoarding. Even in the modest run-up in price in September and October 1986, over $2 billion in gold was dishoarded in a few weeks from the Middle East and South-East Asia.
The Prospect for Gold, p. 131
The ebb and flow [flood] of gold into and out of Switzerland … is an excellent signal to market moods. During the bull market of the late 1970s, stocks built up substantially in Switzerland as banks increased exposure to ten or fifteen per cent of portfolios. This turned into net outflow in 1984 and 1985 as investors became disillusioned with gold and sold out, while the physical offtake … especially in the Middle-East and South-East Asia, picked up on lower prices.
The Prospect for Gold, p. 114
Green reveals why gold is moving from West to East and back. In the past decades, the East was far behind in developing its banking systems and financial markets, in comparison to the West. People in the East kept a stronger affinity with physical gold as a wealth instrument. For millions of people in Asia, gold still is the “basic form of saving” (though nowadays less so than in 1987). In contrast to the West, where financialisation started decades ago, and gold has slowly been removed from the day-to-day lives of people. Until a financial crisis emerges, that is.
In the West, people own little or no physical gold when they feel financially confident. People in the East have retained a long-term view concerning gold. Their ancestors saved in gold, and so have they been taught. With the knowledge that, ultimately, gold doesn't lose its purchasing power.
Tellingly, as Green writes, the jewellery in the East is of high purity and is fabricated with very low mark-ups. The jewellery worn by the women serves the same purpose as the coins and kilobars held by their men: storing value. In Asia, more so than in the West, gold jewellery is a store of value, combined with aesthetics and status.
Because of the Eastern gold mentality, these people are eager to accumulate in a steady market and especially on falling prices. On price highs, they sell some of their gold. People in the West are more inclined to buy physical gold during a crisis, chasing it higher, and liquidating when the crisis has passed or when the price is declining.
Let us walk through a cycle of the pattern. When financial uncertainty hits the West and large capital moves into physical gold, metal is drawn into London and Switzerland, making the price go up. At the same time, as we have just read in The Prospect for Gold, at an escalating price, the East takes some profit and dishoards a portion of its gold by selling it to the West. This is the ebb movement: gold is pulled from the East into the West while the price goes up. When the financial crisis has passed, disinvestment in the West causes the price to go down. The East, then, will absorb the metal on sale while supporting the market from falling further. This is the flood movement: gold flows from West to East at a declining price. (Note the market is not always in an ebb or flood movement.)
We have established that the West is mainly the price maker. The East is price-conscious, because it has a longer time horizon regarding gold. Steadily it accumulates jewellery, bars and coins. When the price declines, purchases increase; when the price spikes, purchases decrease. The East provides a floor for the gold market and dampens volatility.
It's often questioned in the gold community, why demand from India and China doesn't drive the price of gold. Jayant Bhandari, a financial consultant from India, gave a descriptive answer in an interview for the Korelin Economics Report in July 2016. Indian gold demand had decreased in the months before the interview, on which Bhandari commented:
The demand for physical gold has basically stagnated in the country right now. It pays to remember that the Chinese and Indians are very value conscious. These are not the people that drive the price up. These are the people that consolidate the price. And once the price has gone up as much as it has in Indian rupee terms [the price had gone up 30% in 6 months], they lose their interest to buy gold. They want that price to stay there for a while, before they start thinking it will not go fall any further, and that's when consolidation happens, and that's when it creates a base for gold to go up, in their mind.
Jayant Bhandari
Simply put, the Indians prefer not to buy gold at a peak.
Examples of the ebb and flood of gold
Green writes that Western investors accumulated gold in Switzerland in the 1970s. In 1984 and 1985, these “investors became disillusioned with gold and sold out, while the physical offtake … especially in the Middle-East and South-East Asia, picked up on lower prices”. Cross-border gold trade statistics between Switzerland and the UAE show what Green described.
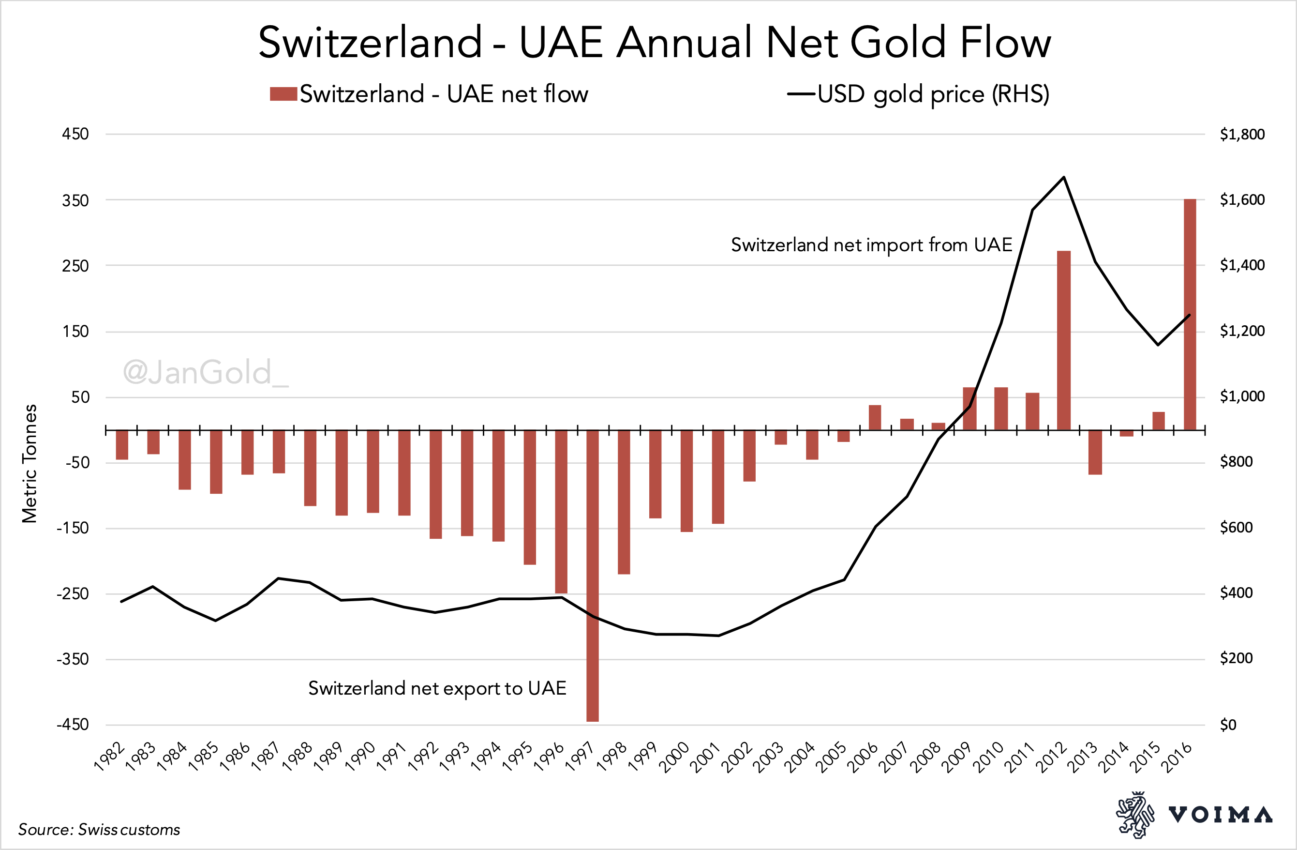
The gold price peaked in 1980 at nearly $850 per troy ounce, after which it cascaded to a low of $285 per ounce in 1985. The East welcomed the sell-off by the West. Starting in 1984, the net export of Switzerland to the UAE increased. The gold arriving in the UAE was redistributed throughout the region. As we can see in the above chart, when the price stabilised throughout the 1980s and 1990s, the East buying from the West intensified until 1997. This fits how Bhandari described the gold mentality in the East: “They want that price to stay there for a while, before they start thinking it will not go fall any further, and that's when consolidation happens, and that's when it creates a base for gold to go up, in their mind.”
As if the souks knew. In the early 2000s, the gold price started to rise, and dispatches from Switzerland to the UAE declined. Finally, in the bull market that followed, the UAE went “into reverse” and started “dishoarding gold back to … Zurich” (Green), from 2006 until 2012. Remarkably, when the price fell sharply in 2013, the UAE returned to a buyer again, and then in 2016, when the price started rising, returned to a seller. Ebb, flood, ebb.
The chart above isn't complete, as it doesn't show many other net flows through Switzerland. True, in 1984 and 1985, Switzerland, in total, was a net exporter. After that, on average, Switzerland itself was not a net seller or buyer until 2005. Although, throughout the 1980s and 1990s, the UK was a net seller to Switzerland, which was mainly sent forward to the East. Possibly, these flows from the UK included sales by Western central banks. (As an aside, we know that in the flood movement of the 1990s, the Dutch central bank sold 400 tonnes through the BIS, and this was partially bought by the Chinese central bank.)
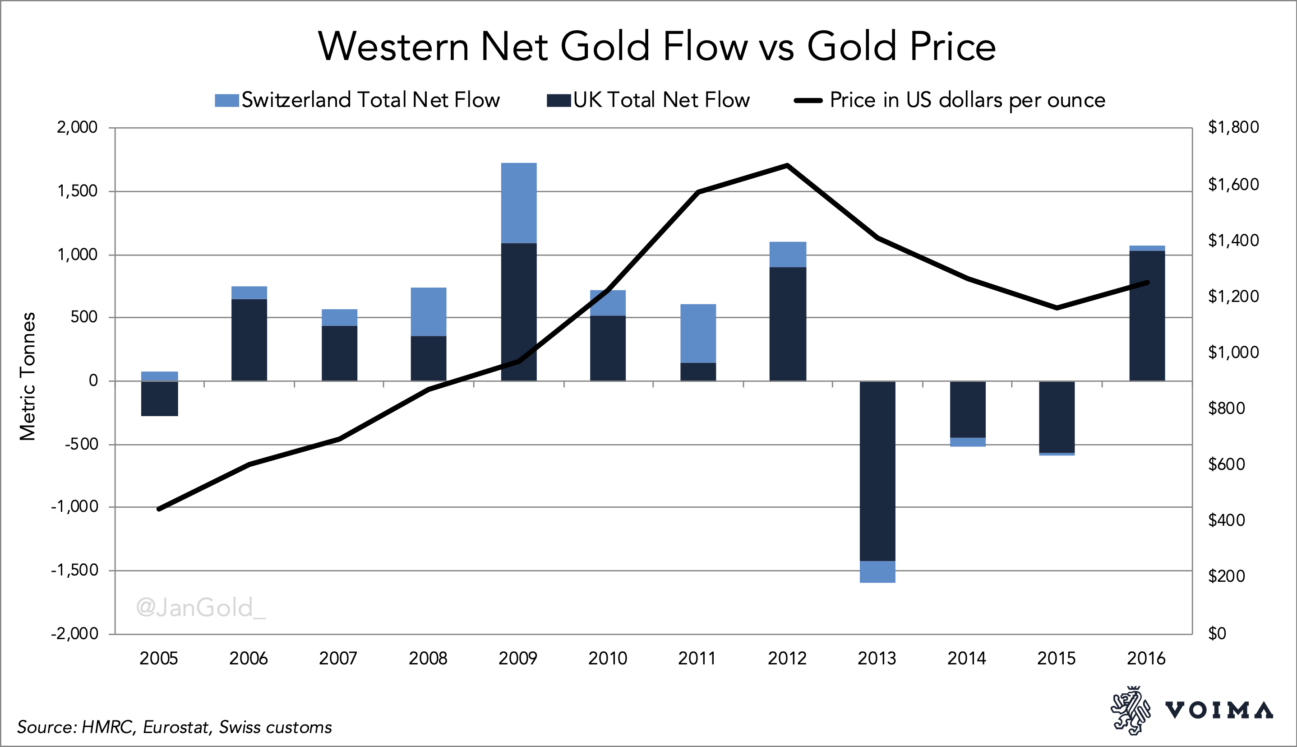
The pattern suggests the West was driving the bull market from the early 2000s until 2012. Reliable trade data from the UK starts in 2005 and shows, together with data from the Swiss, a correlation between Western hoarding and the price of gold (see chart below). In 2005, Switzerland started to accumulate gold, joined by the UK in 2006 when the price was going up. All in line with the pattern, except for 2005, when the UK was a net exporter. According to my analysis, the West was causing the price to rise from the early 2000s until 2012.
Data from Eurostat prior to 2005 shows the UK was also a net importer from 1999 until 2004. I have excluded this from the chart because the exactness of the net imports can be debated. Over this period, the disclosed weight and value traded do not always fully match when compared to average annual gold prices. Nevertheless, the numbers are supportive of my analysis that London was causing the price to go up since 1999.
Subsequently, the West caused the gold price to go down from 2013 until 2015. If we zoom in on Switzerland's gold trade in 2013 per region, we can clearly see the West was selling and the East was buying, when the price of gold slipped by 28% (see chart below). Switzerland is the heart of the global refining industry, and when the UK sold out, its Good Delivery bars were sent to Switzerland to be refined into 999.9 fine kilobars for Asia. In the chart, we can see the West was supplying gold to Switzerland, which was exported to the East.
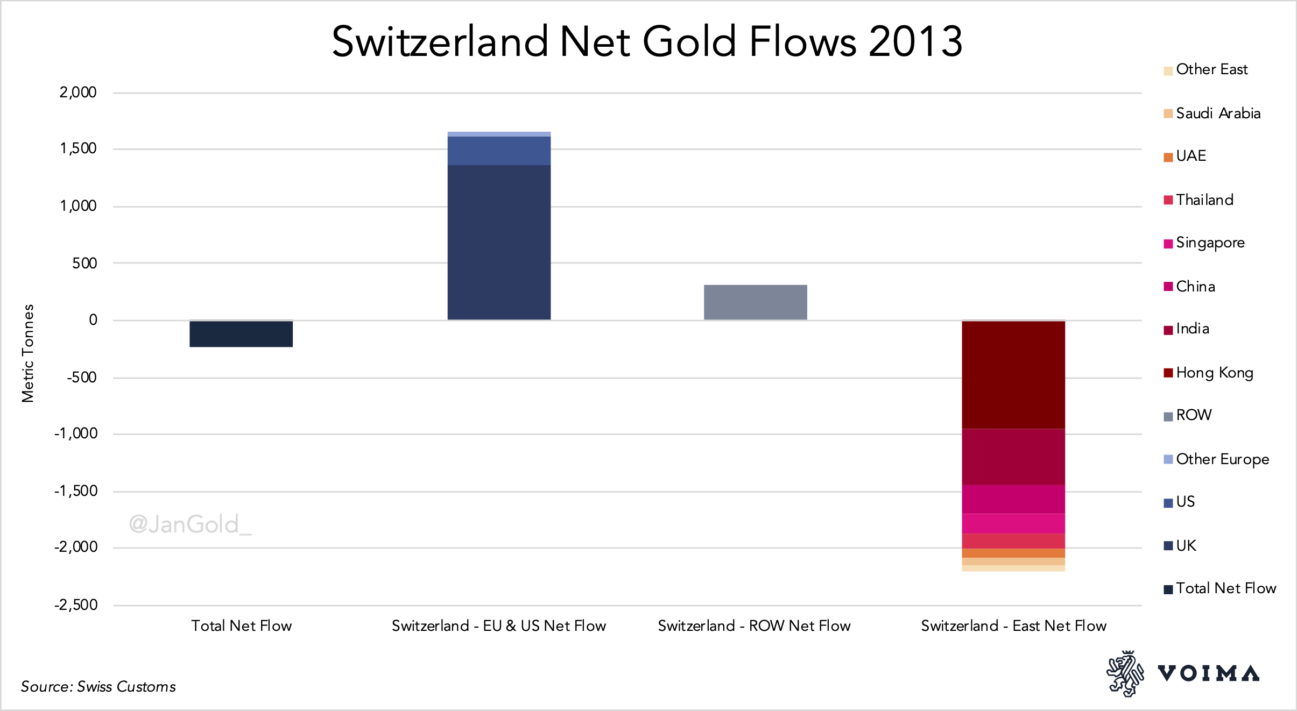
(For the East, I have excluded countries in Asia with significant gold mining output as these will be net exporters at all times and therefore are best to be left out from the ebb and flood analysis. These are included in the ROW.)
In the graph above, Hong Kong looks to be the largest buyer, though this off-take was mainly re-exported to China. At the time, Hong Kong was still the main conduit for gold entering mainland China. Examining Hong Kong's trade statistics shows another reflection of the pattern.
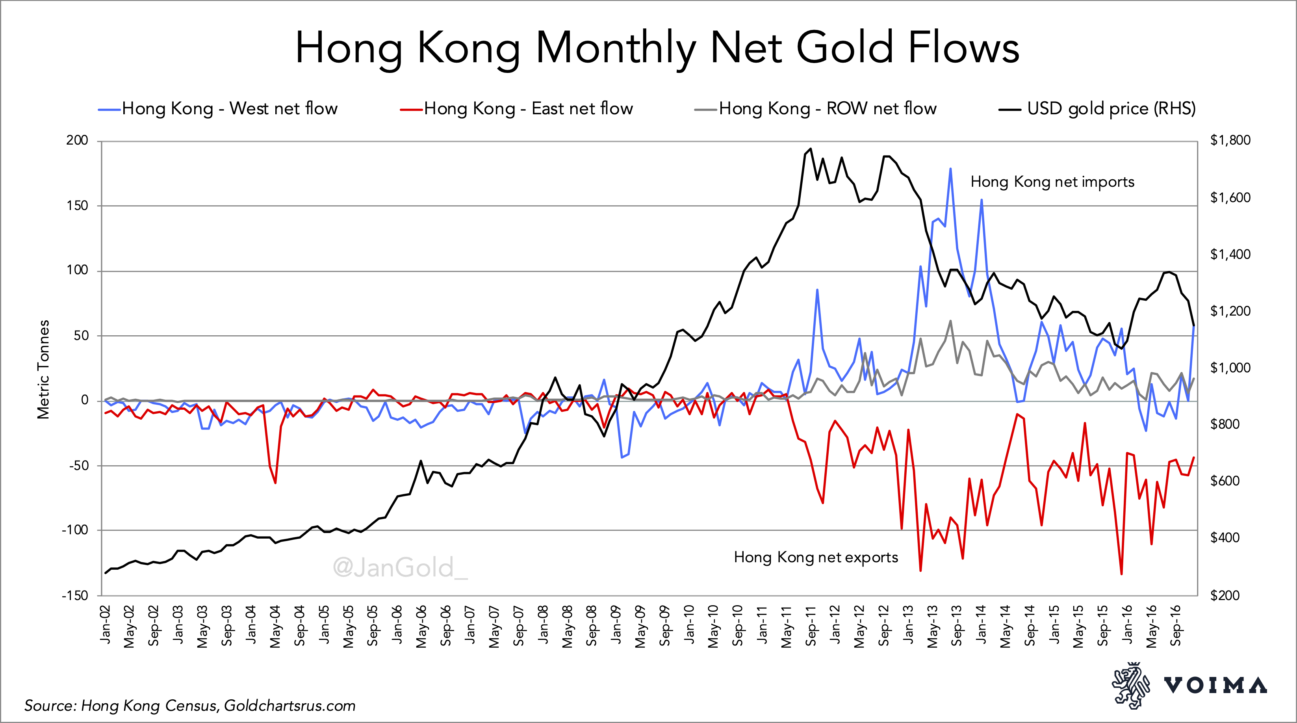
China wasn't a large buyer until 2010, because its economy had only slowly been liberated since the 1980s and its gold market since the launch of the Shanghai Gold Exchange (SGE) in 2002. In 2013, everything was lined up for one of the greatest gold migrations ever. China's newly accumulated economic wealth, its Eastern mentality regarding gold and a falling price caused China to net import roughly 4,400 tonnes of gold from 2013 through 2015. In the chart above, you can see how Hong Kong's net import from the West was nearly a perfect inverse of its net export to the East (mostly China) from 2013 till 2015.
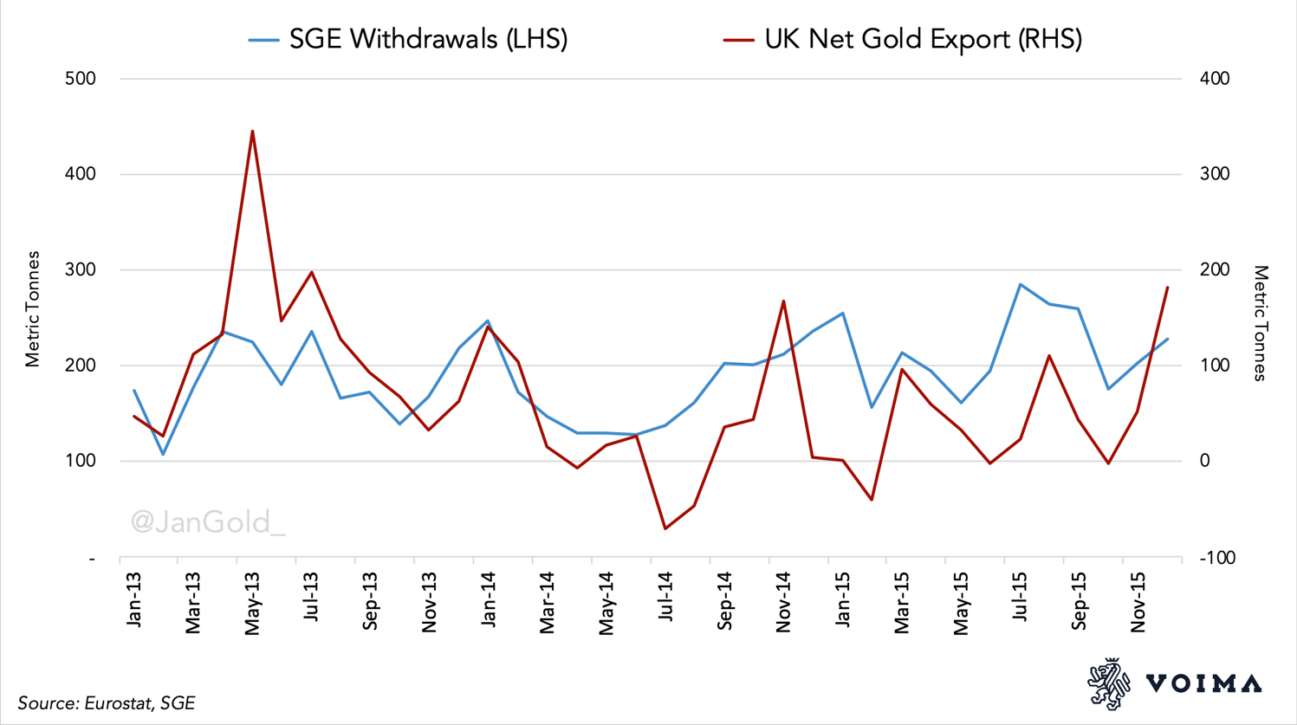
The match between the UK's total net export and withdrawals from the SGE summarises the flood movement: the gold had traveled from the UK, through Switzerland and Hong Kong, eventually to arrive in the mainland.
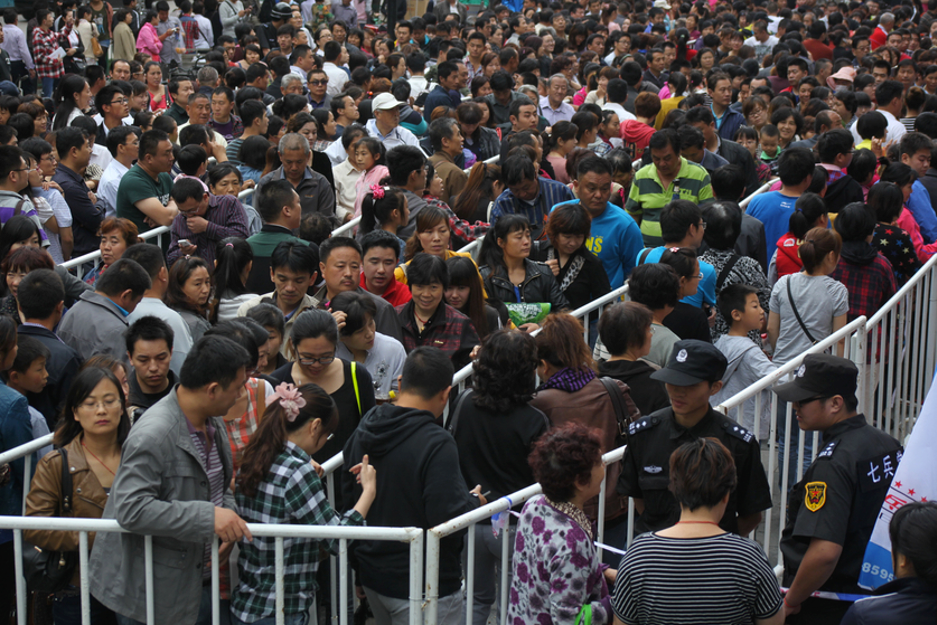
Let me add two anecdotal illustrations of the pattern. When the gold price sharply declined in 2013, long queues formed at Chinese jewellery stores. As mentioned before, the East eagerly hoards physical gold when there is a good buying opportunity.
In the Western part of the world, in the UK, when the gold price increased by 22% in less than two months—from 705 GBP/oz on 15 December 2015 to 863 GBP/oz on 11 February 2016—one local dealer reported: ´It's been crazy—it's been the best week since 2012. We've had people queuing round the block.´
It shows that in the West, there are runs on gold when the price is rising, while in the East lines are forming when the price is falling. Realising gold trades as a currency and the cultural differences on both sides of the planet is essential for understanding the gold market.
Earlier observations of the ebb and flood
The further back in time, the less granular data is accessible. For this chapter, we will analyse the ebb and flood pattern based on the historical data available, substantiated by quotes from Green and other authors. Possibly the first ebb movement occurred during the Great Depression of the 1930s.
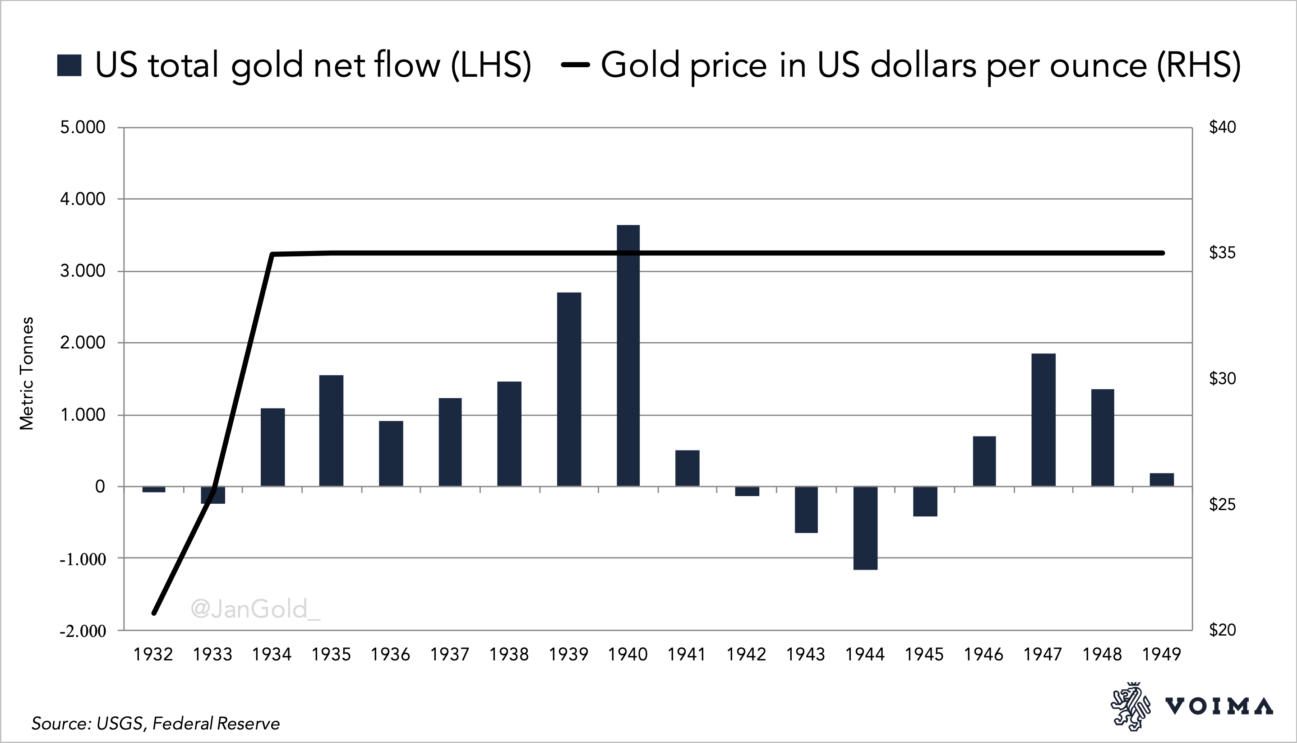
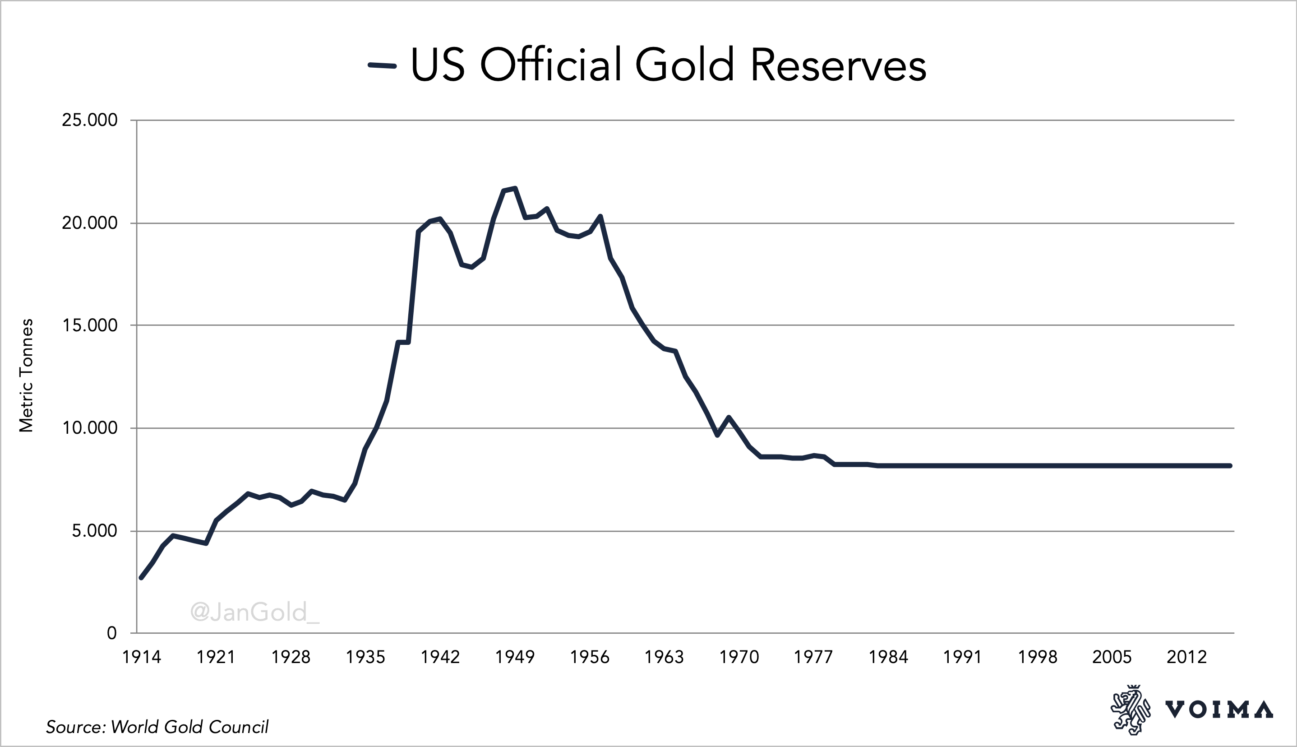
In total, the US net imported 14,000 tonnes of gold from 1934 until 1949. The metal imported caused the US official gold reserves to reach its peak in 1949—and Fort Knox to be packed to the rafters—as the gold inflow went straight to the Treasury's coffers.
The economists Frank D. Graham and Charles R. Whittlesey wrote a book on the greatest physical gold migration ever, titled Golden Avalanche (1939). On page 16, we find evidence of an ebb movement occurring 80 years ago:
For hundreds, perhaps thousands, of years the demand for gold in the Orient was so large and constant that the East was referred to as a “sink for the precious metals.” Since 1930, however, the Orient has been not a sink but a spigot. Hoarding has given way to dishoarding; in the early 'thirties a billion and a half dollars' [1,333 tonnes] worth of gold poured out of India and China and was added to the stocks of gold available in world markets. Smaller, though substantial, sums were also released from private hoards in Western countries. In other words, a usual source of demand has, in recent years, turned into a source of supply.
Golden Avalanche, p. 16
What unfolded in international economics during the Great Depression is very complicated. My simplified analysis is that India and China sold because gold's value increased.
India and Britain simultaneously went off the gold exchange standard in September 1931 to devalue against gold. As a consequence, the gold owned by the population in India, accumulated throughout history, surged in value. The Indian people alleviated the depression by selling gold in world markets. In Britain and the Indian Currency Crisis, 1930–2, B. R. Tomlinson writes (“Rs.” stands for “Rupees”):
With sterling and the rupee depreciated it was now possible to sell gold in London at a considerable profit, and large amounts of commodity gold began to be exported from India. … between September 1931 and March 1939 India's net exports of gold totalled Rs. 3,072 million (£230.97 million) worth [1,196 tonnes], … Gold was the preferred savings medium of the vast bulk of the Indian population [hence, India had always been a “sink” for gold]. … The gold exports effectively solved the problems of Indian currency and finance, strengthening India's balance-of-payments surplus on private account and, in I932-3, giving it a visible balance-of-payments surplus with Britain for the first time this century.
Britain and the Indian Currency Crisis, 1930–2
When the global economy began slowing down in the late 1920s, the price of silver started declining. China was on a silver standard and initially its economy benefited from the cheapening of world silver, as it made yuan depreciate. Eventually, China got caught in the currency wars that ensued. A depression followed, and China was forced to abandon the silver standard in 1935. Suffice to say gold savings in China went up in value starting in 1926, and proved a war chest in times of economic hardship. China and Hong Kong dishoarded 238 tonnes in the 1930s.
The government of the United States confiscated its citizens' gold and subsequently abandoned the gold standard internally in 1933. Externally, the fixed parity between the dollar and gold was maintained, even after President Roosevelt devalued the former against the latter by 41%1] in 1934. The new parity made the US Treasury buy gold in exchange for $35 per troy ounce from all over the world. Resulting in imports of gold of unprecedented proportions. The metal dishoarded by China and India, “added to the stocks of gold available in world markets”, ended up in the vault at Fort Knox, Kentucky.
Samuel Montagu's Annual Bullion Review commented on the Golden Avalanche passing through the London Bullion Market in the 1930s:
A flow gold commenced … which quickly reached flood [ebb] proportions, …Never before has such a huge movement of gold taken place in so short a time.… Accommodation of all mail steamers was booked well ahead and many other vessels than the regular liners were pressed into service as bullion carriers …. The US Treasury officials were overwhelmed by the inrush and at first there was considerable delay in making settlement for gold tendered.
Annual Bullion Review
By 1949, the official gold reserves of the US reached 21,707 tonnes, while all gold above ground accounted for 69,000 tonnes. The US Treasury owned over 30% of all gold above ground, and 70% of all monetary gold.
Under Mao, “the people” were not allowed to own bullion; however, the People's Bank of China was—and it considered gold to be undervalued in 1965. That's because the US was printing too many dollars relative to the amount of gold backing them up at the fixed price of $35. And since most currencies were, at the time, pegged to the US dollar, a consortium of Western central banks (known as the London Gold Pool), was therefore desperately, yet openly, selling physical gold into the London Bullion Market to defend the price at $35. Pegs don't tend to last, and the Chinese knew it. Green writes in The World of Gold Today (1973):
While Russia, as a major producer of gold has been a heavy seller in world markets, China has stepped in from time to time as a considerable purchaser. In 1965 (at the same moment that France was making her big gold purchases), China bought 100 tons of gold worth $110 million on the London Market; the following year she came back for another 30 tons. Two years later China topped up with another 60 tons. The main reason behind these forays into the gold market appears to have been to divest herself of sterling. Although no official figures of China's reserves are available, it is likely that she substituted a good part of her holding of sterling for gold before devaluation in 1967.
The World of Gold Today, p. 188
Wolfgang Schulte of the Bundesbank's Gold Competence Centre writes in Germany's Gold (2018):
The situation in the gold market changed dramatically from 1965 onwards, with the [London] Gold Pool [consortium of Western central banks] increasingly serving as a selling syndicate. The Vietnam War, fears of further devaluation of the pound sterling, and massive gold purchases by China added to the geopolitical and economic forced behind increased gold purchases and surging prices in the free market.
Germany's Gold, p. 84
According to page 115 of The New World of Gold, as pressure was building on the price of gold at $35, in 1968 “U.S. airforce planes rushed more and more Fort Knox gold to London, and so much piled up in the Bank Of England's weighing room that the floor collapsed.”
The Golden Avalanche into the US in the 1930s was reversed in the 1960s. Gold flooded out of the United States with an accelerating speed; to the extent that and on 18 March 1968, it was announced the Gold Pool had “to suspend operations”. The Gold Pool gave up; the price of gold was set free.
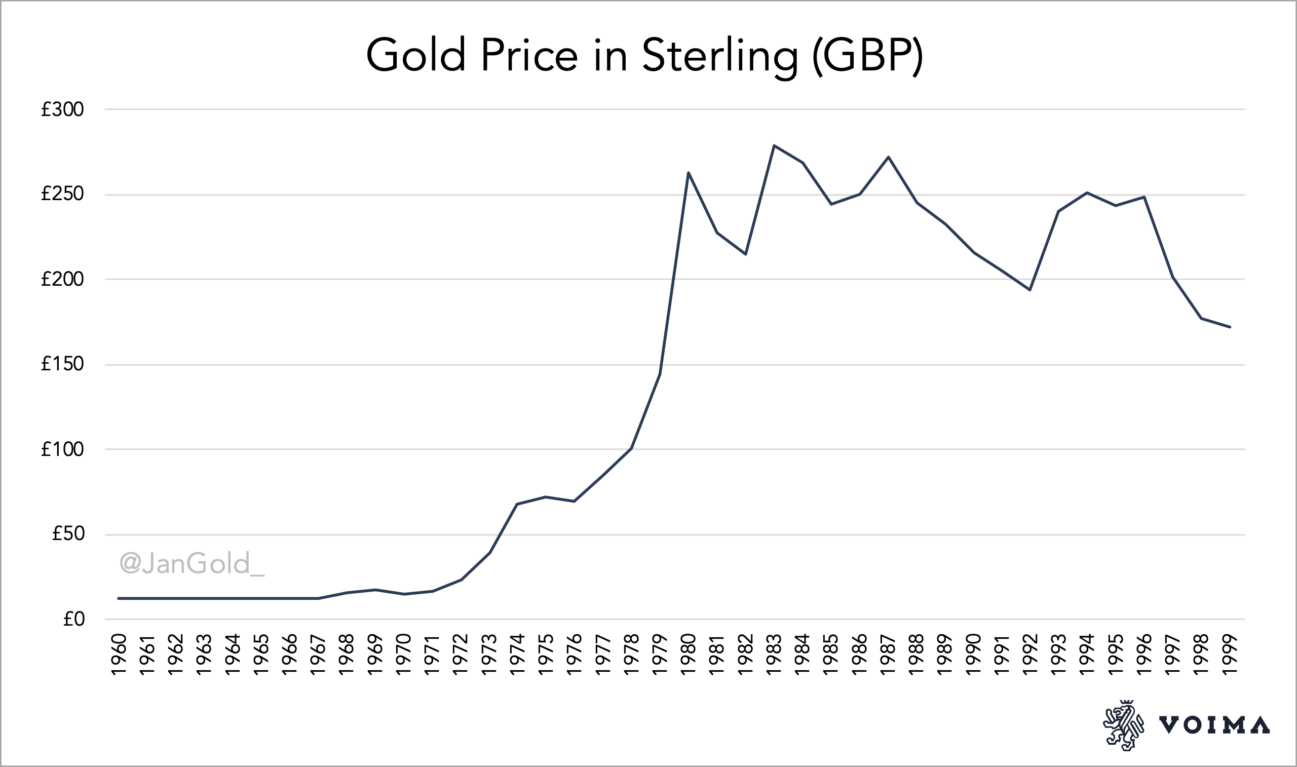
From 1967 until 1980, both the dollar and sterling lost more than 90% of their value relative to gold. China had exchanged sterling for gold just in time.
According to Green, the East played the bull market well. In The Prospect for Gold, he talks about the pattern in the 1970s:
These signposts are not much use to the floor trader on Comex, who lives only for the next moment, but they are useful both to the gold miner and long-term investor. For they point to the ‘safety net' for the gold price provided by the demand in South-East Asia, India, and … the Middle East. This ‘safety net' checks a falling price when people see gold as ‘cheap'. Certainly the lesson of the souks is that they get the long term trends right. … They bought gold in 1970 at $45, sold out close to $200 in 1974, started in again at $110 in 1976, and sold out in 1980.
Prospect for Gold, p. 140
The “safety net” is the same as the “floor” (supporting the gold price) I referred to earlier.
In The Structure and Operation of the World Gold Market (IMF, 1991), we can read what happened in late January 1980:
The flow of gold from jewelry to speculative holdings through the scrap market has been vividly described by Green (1981), after prices peaked on January 19, 1980. Initially, the loco-London price gained a substantial premium (in some cases, 40 percent) over small local markets (principally in the Middle East and Far East). Then, according to Green (1981, page 28), “within a very few days a wave of reselling of jewelry and coin on an unprecedented scale developed.” Green continues (page 29):
The scale of individual dishoarding was often substantial. I was in the Kuwait souk the day gold hit $850 [1980]. The street of gold shops was under siege. Perhaps two or three thousand people milled around, fighting their way into the overcrowded shops with cigar boxes and biscuit tins crammed with bangles and necklaces. The goldsmiths weighed the ornaments—often two or three kilos from one woman—and paid cash. Those ornaments were melted down in a nearby basement and the rough gold bars air-freighted to London and Zurich the same night.
The Structure and Operation of the World Gold Market
We can read that when the gold price was touching its highs in 1980, the premium in London was 40 percent over prices in the East, implying the West was driving the bull market. The souks were selling high, “…the … gold … air-freighted to London and Zurich the same night.” An ebb movement.
Conclusion
I have presented the ebb and flood pattern in a way so its essence can be best understood: the price is mainly set in the West, where the sentiment is determined by “trust in central banks” (rushing in and out of this safe haven). The East has a long-term view regarding gold. It prefers to buy low and sell high, which dampens volatility. The pattern improves our understanding of the gold market. For example, in 2019, the dollar price of gold increased by approximately 15% from June until September. In those four months, the gold demand of India and China collapsed, while London net imported a whopping 615 tonnes. Lacking knowledge of the ebb and flood pattern can lead to confusion about cause and effect in the market, and false analyses. What happened, though, fits perfectly in how the gold market has behaved for decades. If one is aware, one will recognise the pattern (for example, here, here, and especially here).
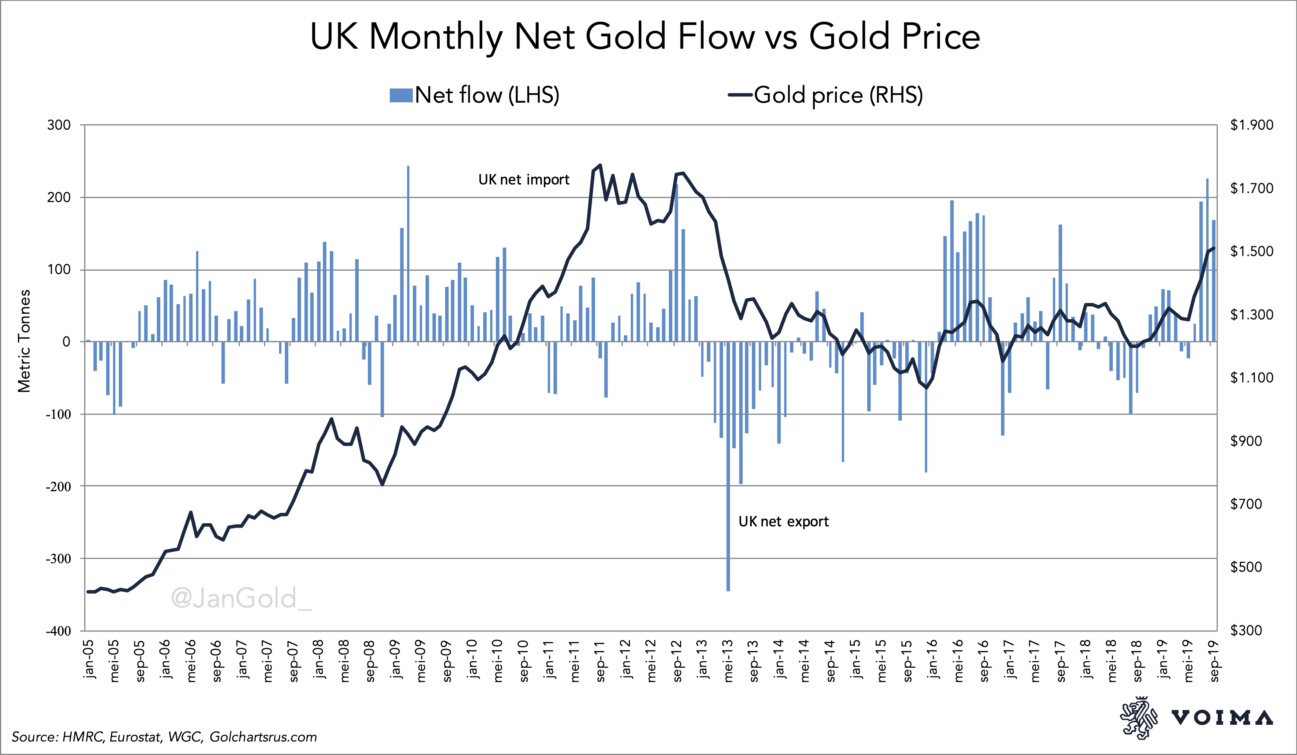
In the chart above, the monthly net flows through the UK show a positive correlation with the direction of the gold price 67% of the time. Next to the fact this correlation is notably high, in my previous article and this one, I have provided a framework for understanding the correlation: gold trades like a currency, institutional supply and demand sets the price, and cultural differences explain why it's set in the West. In a forthcoming article we will discuss the interaction between the COMEX futures market and the London spot market.
Don't be surprised if in the current bull run London will absorb more gold, while demand in the East will grind to a halt. Some Asian countries possibly turning into a supplier.
In final, the pattern is not a clean theory. I have omitted elements in this article that would make my message blurrier. For example, not with every ebb movement is the East in total a net supplier. Regarding the 1930s and 1960s, these were a global phenomenon. The whole world supplied the Golden Avalanche, and the London Gold Pool was certainly not broken only by China.
Credits
First, I would like to thank Timothy Green for writing outstanding books on gold. Second, big hat tip to a frequent commenter on gold blogs rowingboat for bringing to my attention how international gold flows move in sync with the price of gold. Third, Nick Laird from Goldchartsrus.com for advising me what books to read and his services of providing gold data. Thank you, Nick! Fourth, I would like to thank my Twitter-follower Winson Chik.
In search for Hong Kong's foreign trade statistics from before 2001, the Hong Kong Census and Statistics Department (HKCSD) told me these books could only be accessed at their “Service Centre on Trade Statistics at 19/F Wanchai Tower, 12 Harbour Road, Wanchai, Hong Kong”. Winson spent great effort in copying all the documents and building excel sheets. Unfortunately, it appeared the HKCSD had deleted its gold export data from 1972 until 1997. Net flows from this era cannot be computed.
The views expressed on this post are those of the author and do not necessarily reflect the official views or position of Voima.
You are allowed to copy our content, in whole or in part, provided that you give Voima proper credit and include the appropriate URL. The name Voima and a link to the original post must be included in your introduction. All other rights are reserved. Voima reserves the right to withdraw the permission to copy content for any or all websites at any time.
Nothing written in Voima's blog or website constitutes investment, legal, tax or other advice. It should not be used as the basis for any investment decision which a reader thereof may be considering. The purpose of Voima's blog is to provide insightful and educational commentary and is not intended to constitute an offer, solicitation or invitation for investing in or trading gold.
-
Because any devaluation of a currency must be in between 0 and 100%, for this article all devaluations are measured in gold. For example, when the US dollar price of gold went up from $20.67 to $35 in 1933–34 (a surge of 69% in the dollar price of gold), I have noted this as a 41% devaluation of the US dollar. ↩