Voima Markets Newsletter—December 2022
Sam Laakso
Head of Voima Markets
Currency market table
| Gold price in | November | 3M | YTD | 1Y | 3Y | 5Y | 10Y | 20Y |
|---|---|---|---|---|---|---|---|---|
| USD | 8.29% | 6.55% | −3.28% | −0.30% | 20.80% | 38.77% | 3.15% | 454.29% |
| CAD | 6.59% | 3.34% | 2.65% | 4.64% | 22.02% | 44.31% | 39.12% | 374.95% |
| SEK | 3.06% | 1.01% | 12.25% | 15.95% | 32.40% | 73.85% | 62.20% | 542.23% |
| GBP | 3.02% | −1.34% | 8.52% | 9.92% | 29.57% | 55.65% | 36.96% | 615.75% |
| EUR | 2.86% | 0.35% | 5.63% | 8.58% | 27.84% | 58.68% | 28.67% | 429.63% |
| NOK | 2.60% | −3.67% | 8.05% | 8.58% | 28.92% | 64.14% | 79.14% | 644.53% |
| CHF | 2.29% | 2.12% | 0.27% | 2.64% | 14.27% | 33.45% | 5.15% | 253.51% |
| AUD | 2.10% | 0.56% | 3.45% | 4.62% | 20.38% | 54.68% | 58.44% | 357.77% |
| JPY | 0.51% | 1.61% | 16.01% | 21.64% | 52.27% | 70.23% | 72.69% | 524.71% |
The weakest currency of the month in November was the US dollar (USD).
Top news in the markets recently
US consumer inflation eased to 7.7% over past 12 months (AP News)
Ghana plans to buy oil with gold instead of US dollars (Reuters)
Eurozone manufacturing downturn continues in November but inflationary pressures ease further (S&P Global)
China's reported gold reserves rise for first time since 2019 (Reuters)
Trader's comment 8 December 2022
Counter-trend moves
The key theme in the markets in November was the continuation of counter-trend moves. Stocks bounced, the US dollar corrected and gold bounced against all major currencies. The correction in the US dollar caused gold to rally the most in the US dollar terms, whilst the move against other currencies was more subtle.
As stocks and gold rallied in November, their volatility indices have fallen to sub 20 (VIX) and 16 (GVZ) respectively and now are on the verge of breaking down, which would be a bullish sign for both assets—liquidity tends to flow to asset classes with falling volatility. With the volatility profile looking decent for both stocks and gold, it is worth looking at the bigger picture—the macroeconomic environment.
The US 10Y2Y yield spread hits a chilling −79 bps—lowest since 1981
The US “10-year treasury yield minus 2-year treasury yield” spread is a commonly cited health measure for the US economy. In a healthy economic environment, the US 10-year treasury bond pays higher interest compared to the 2-year treasury bond. This makes sense as investors demand higher returns (higher yield) for lending their money to the US government for ten years versus two years as there is more uncertainty over ten years compared to two years. In an unhealthy environment, the yield curve can invert, meaning that investors are temporarily demanding higher yield for shorter maturities.
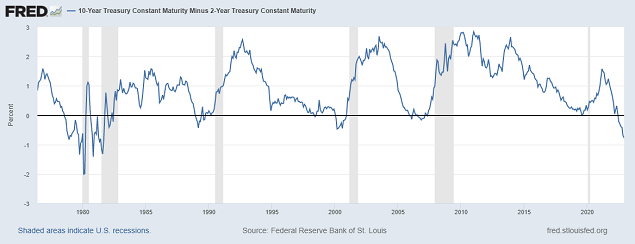
Although this is just a single indicator, the yield curve inversion has preceded every single recession in the US since 1976. Right now, the yield curve inversion stands at −79 basis points (−0.79%), which is the lowest figure since 1981 and much deeper compared to the inversions which preceded the 2000 tech bubble recession and the global financial crisis of 2008. This has happened at the same time as the US treasury liquidity has fallen and volatility has increased substantially.
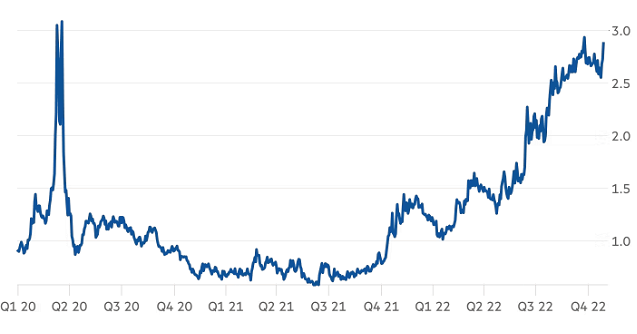
Treasury liquidity is at its weakest level since March 2020
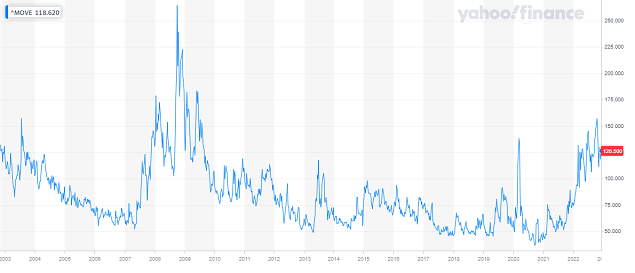
Treasury market volatility has soared this year
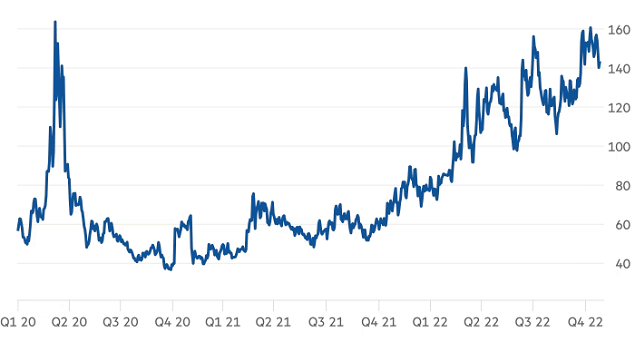
Rising volatility and falling liquidity in US treasuries are not bullish signs for risk assets, and currently the volatility profile of US treasuries better resembles the early stages of the 2008 global financial crisis than an orderly economic expansion. At some point, yields will top together with the Fed funds rate—which is currently priced to top in Q2 2023—but as monetary policy works with a 6-to-18 month delay, the inevitable Fed pivot provides no support to stocks. The treasury market volatility is likely to remain high at least until then.
Inflation and economic slowdown = recession
Both producer and consumer inflation indicators continue to slow down while at the same time economic conditions across the developed world continue to deteriorate. For example, in the eurozone manufacturing PMI figures remained at a level typical for a recession, consumer confidence remains at COVID-lows while at the same time the eurozone PPI continues to decelerate from all time highs.
You always want to remain flexible for new data as it comes in, but as of now, leading economic indicators and the bond market are not signaling economic growth nor a bull market for stocks, but rather they point towards an imminent recession. The key question to ask is not when central banks will pivot but rather what assets allocation you should be in during a recession.
With these economic realities in mind, the current macroeconomic environment remains bearish for growth-sensitive assets, such as stocks, and continues to favour risk-off assets, such as the US dollar and gold. During this year's slowdown of inflation growth and economic growth, gold has been under pressure—every slowdown behaves differently, and so far this one has been characterised with unprecedented liquidity constraints.
If gold were to have a bullish breakdown in volatility—or if volatility in other asset classes started to rip higher—this would signal a bullish trend shift for gold, which is typically a good asset allocation when both inflation and growth decelerate. In addition to a potential bullish breakdown in gold's volatility, gold tends to have high correlation with its seasonality, and from this perspective, gold is about to enter the most bullish season of the year in January. These are from a US dollar perspective, and as you can see from the currency market table above, gold has been performing relatively well throughout the year in other currencies. The very short term remains uncertain for gold, but there are positive signs of a potential bigger trend shift—which is inevitable considering the marcoenvironment we are looking at in 2023.
Ghana's plan to buy oil with gold
The Vice President of Ghana, Mahamudu Bawumia, said in late November that the country was working on a new policy which would enable Ghana to buy oil products in exchange for gold instead of US dollars. The policy is supposed to be implemented during the first quarter of 2023, although most of the practical arrangements are still open.
The initiative is meant to improve the balance of payments of Ghana, which is a major gold producing nation, and help strengthen Ghana's national currency, the cedi. Like many developing world currencies, the cedi has been under significant pressure due to the strength in the US dollar. The initiative is Ghana's response to the global US dollar shortage, which has caused inflation throughout the developing world, Ghana included. (Even though a huge amount of dollars has been created recently, their distribution has been uneven and now, partly because of the rate hikes, the demand for dollars is much greater than for other currencies. This has—slightly paradoxically—caused a global shortage of dollars.)
Although Ghana's initiative is small in size, it is in line with the remonetisation trend we have seen in gold since the global financial crisis of 2008. In addition to the gold accumulation trend led by certain Eastern central banks, countries like Russia, Malaysia, Iran, Turkey, and Venezuela have all advocated for gold to be used more widely in the settlement of international transactions.
In addition to the acute US dollar shortage, another key factor driving these comments is that the US has increasingly weaponised the dollar through sanctions. This has led to countries looking for alternative ways of settlement outside the US dollar's reach. So far, this has manifested as bilateral trade agreements which bypass the use of the US dollar, and it has undoubtedly also spurred the suggested gold-based trade arrangements.
So far, the suggested gold-based trade arrangements have not led to major changes in international trade, which remains dollar-dependent. Time will tell how Ghana's system will work but as it was said, Ghana's initiative is one of many in the gold remonetisation trend, which is likely to intensify as currency market volatility and geopolitical tensions remain high.
Disclaimer
The views expressed on this post are those of the author and do not necessarily reflect the official views or position of Voima.
You are allowed to copy our content, in whole or in part, provided that you give Voima proper credit and include the appropriate URL. The name Voima and a link to the original post must be included in your introduction. All other rights are reserved. Voima reserves the right to withdraw the permission to copy content for any or all websites at any time.
Nothing written in Voima's blog or website constitutes investment, legal, tax or other advice. It should not be used as the basis for any investment decision which a reader thereof may be considering. The purpose of Voima's blog is to provide insightful and educational commentary and is not intended to constitute an offer, solicitation or invitation for investing in or trading gold.