Voima Markets Market Commentary—December 2022
Sam Laakso
Head of Voima Markets
Introduction
The year 2022 will go down as the year when geopolitical tensions reached a new high as Russia invaded Ukraine, inflation escalated to multidecade highs to which central banks responded by performing the steepest rate hiking cycle since the 1970s. Central bank gold purchases also reached a 55-year annual record just three quarters into the year, and as of December, the purchases are looking to reach even higher. These are just a few of the extraordinary developments of 2022. We start 2023 with persistently high inflation and geopolitical tensions, together with increasing economic uncertainty, which is looking to turn into a recession, whose severity remains yet to be seen.
In November's Voima Markets newsletter, I suggested that our current inflation crisis could escalate into a currency crisis. This market commentary takes a look at how inflation crises can turn into currency crises, why central banks are buying gold and what it means, as well as my outlook for gold in 2023.
From an inflation crisis to a currency crisis?
Inflation has been the hot topic of 2022 for both the investment world and households. In many countries, inflation is at its highest level since the 1970's inflation crisis. The current wave of inflation, which started in the summer of 2021, has lifted prices across the board and is no longer considered transitory or sector-specific. With high energy prices causing havoc in Europe to both consumers and companies, and food prices rising manifold, at this point it is appropriate to call the current inflation environment a proper inflation crisis.
The current inflation crisis in the EU was most likely considered a true tail-risk scenario (something that is considered to be very unlikely) by most investors just a few years ago. So let's explore the tail-risk scenario of the current tail-risk environment—a currency crisis.
What are currency crises?
Definitions vary but generally speaking a currency crisis means a rapid involuntary depreciation in the value of a national currency. Currency crises typically take place in developing nations where the real economy has been performing poorly whilst simultaneously politicians have maintained unsustainable economic policies, often related to large deficit spending without a reliable plan for correcting these policies. This causes investors and ordinary citizens to sell the local currency in exchange for a more reliable foreign currency. The selling causes the local currency to fall in value, which can cause a rapid downward spiral in the value of the currency. This is called a currency crisis.
Currency crises are characterised by rapid inflation, high volatility in the financial markets, banking crises, capital flight leading to capital controls, and economic turbulence. During a currency crisis, everything gets revalued and especially domestic investments often suffer great losses while international investment valued in other currencies are considered safe. Currency crises can in some cases lead to civil unrest or even to large-scale humanitarian crises, such as the one in Venezuela. The unifying factor in currency crises is that ordinary citizens lose the savings that they have in the local currency, and their labour income is devalued as everything becomes rapidly more expensive.
Government-orchestrated devaluations, such as the one Ukraine did in July 2022 by devaluing the Ukrainian hryvnia by 25% against the US dollar, are not considered currency crises as they are deliberately executed. However, even a government-orchestrated currency devaluation can cause a currency crisis if, for example, the market thinks that there will be further devaluations. The effect of deliberate currency devaluations is the same for ordinary citizens.
Although the inflation we are seeing today in Europe and North America is causing significant distress to households, we are still far from the economic and humanitarian suffering posed by a proper currency crisis.
The cure for currency crises
To fight currency crises, governments and central banks can either sell foreign exchange reserves (buying back their own currency and thus supporting its price) or raise interest rates (which generates demand for the currency as the bonds measured in that currency provide better yield). Both are often used during a currency crisis, but ultimately raising interest rates high enough is the only solution to meaningfully increase the demand for the national currency. However, the tools which governments have for fighting a currency crisis are very limited in reach and do not guarantee the end for the crisis, because ultimately markets and the people decide whether a currency is trustworthy or not.
Arguably, the US managed to avoid a currency crisis in the 1970s by raising interest rates. The Fed raised its benchmark interest rate from less than 4 per cent to 20 per cent during the 70's inflation crisis. In the end, this reassured investors of the viability of the US dollar, preventing the inflation crisis' escalation into a currency crisis.
The frequency of currency crises in the world has been rising
When foreign exchange rates were fixed and money was backed by gold or silver, there were fewer instances of large-scale currency crises. Currency crises became more frequent first when floating exchange rates were first introduced on a large scale in the 1970s. The current monetary system has allowed inflation crises and subsequently currency crises to flourish.
If we take a look at the number of countries with banking crises—which have similar characteristics to currency crises and thus offer us a proxy to the frequency of currency crises—we can see that the frequency of banking crises started to pick up after 1970 when the US abandoned the gold standard and reached a peak in the 1990s during the Asian financial crisis.
The number of countries having a banking crisis in each year since 1800
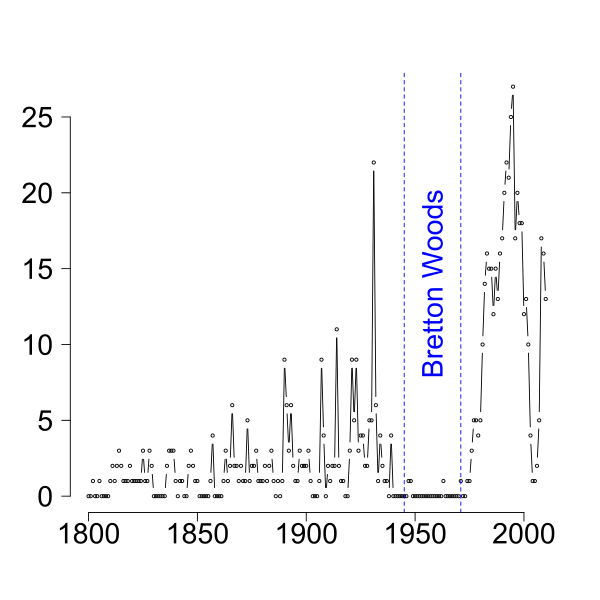
The chart above dates to 2008, and so the fallout of the global financial crisis of 2008 is not fully represented. We can see that during the Bretton Woods monetary system—when fixed exchange rates were used, currencies were backed by the US dollar, which in turn was backed by gold—banking crises were almost nonexistent. This changed in the 1970s, when the Bretton Woods monetary system was abandoned.
In the 1970s, currency crises sweeped the world as the markets priced and got used to the new global monetary system based on floating exchange rates. The peak in the frequency of banking crises was reached in the late 1990s, after which the global financial system stabilised for a while until 2008. Since then the fragility of the global financial system has grown and currency crises have re-emerged.
Just over the past decade, we have seen some major currency crises and unintentional currency devaluations in Sudan (since 2012–), Venezuela (2013–), Argentina (2014–), Ukraine (2014–2015 and 2022–), Turkey (2017–), Zimbabwe (2018–), Iran (2018–), Ethiopia (2019–), Sri Lanka (2022–), and Russia (2022–). The list is not exhaustive. In addition, there are dozens of countries where annual inflation is over 20% and the possibility of an escalation from an inflation crisis to a currency crisis cannot be ruled out.
Also, bigger and bigger economies seem to be hit by currency crises, and severe financial crises loom in many countries currently struggling with double- or triple-digit inflation. Even in the eurozone, annual inflation has reached 10 per cent and even exceeds 20 per cent in some of the EU countries.
This poses the following questions: What would a currency crisis look like in the West and how likely is it that the current inflation crisis escalates to a currency crisis?
Analysis and the probabilities of currency crises
From a historical perspective, the probability of more currency crises in the world over the next decade is 100%. Where and how severe they will be, remains an open question. More currency crises will take place across the developing world, but today it is not entirely improbable that the West would also experience a currency crisis.
In the past 50 years, currency crises have been easy to measure against, for example, the US dollar, as these crises have been local and the US dollar has been a relatively stable unit of measure. However, as the global economy has become more and more intertwined, financial, banking and inflation crises have also become global. The current inflation crisis also affects the United States and the US dollar.
It is possible that we could see a currency crisis in the West which could not be measured in the US dollar. Let's imagine a global currency crisis in which foreign exchange rates between major currencies like the euro, the Swiss franc and the US dollar would remain relatively stable, whilst at the same time we would see persistent annual inflation of more than 10% for several years.
In this scenario, you could still exchange one dollar for one euro year after year, but each year both of those currencies would have lost 10% of their purchasing power. If such an environment would last long enough, this could be also called a currency crisis of sorts and could prompt severe socioeconomic and humanitarian crises. Another more direct way a currency crisis could unfold in the West would be a shorter but more intense rush of inflation, which would devalue a Western currency like the euro by more than 50% in just a few years.
The actual path from the current inflation crisis into a currency crisis is more likely to resemble something we saw in the 1970s. During the 70's inflation crisis, inflation first peaked at 6.4% before falling to 3%, after which inflation rose to 12.2% and fell again to 5% before climbing to over 14%. Officially, consumer prices in the US rose by more than 100% in the 70s, while gold prices rose by more than 2,400%—a proper currency devaluation, whose escalation into a currency crisis was only avoided by raising interest rates to unprecedented levels.
Annual inflation from 1961 to 1990 in the US measured by the consumer price index (CPI)
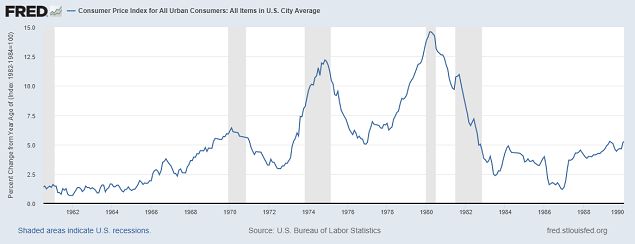
As we can see from the chart above, during the 70's inflation crisis, inflation came in waves and was not over in more than a decade. It is worthwhile to remember that, despite the inflation crisis in the US, the US dollar was the number one reserve currency of the world in the 1970s as it is today. If another Western currency were to experience a similar escalation of an inflation crisis today as the US dollar did in the late 1970s, a currency crisis could well be unavoidable. Central banks around the world have also diversified their foreign exchange reserves out of the US dollar into assets like gold. This implies that the US dollar's immunity towards currency crises—which comes from the fact that the US dollar is the number one reserve currency of the world—is slowly but surely coming to an end, although it is likely that other Western countries experience their currency crises before the US does.
The West has been moving towards the crisis we are in today ever since the 2008 financial crisis, when central banks sowed the seeds of today's inflation with their monetary policies. We are still on the same path and heading towards a similar era which the US saw in the 1970s. Alternatively, if there would be a substantial catalyst, we could see a currency crisis unfold in the West at a faster rate.
Some of the potential catalysts which are in the realm of possibilities in the coming few years include a resurfacing of the European debt crisis, the EU falling apart, further escalation of the Russia-Ukraine war into new countries, a war between the US and China, or a civil war in the United States. These scenarios are not baseless claims as today you can hear even the most respected macro investors like Ray Dalio discussing these possibilities.
The path we are on has been laid years ago, and there are potential catalysts for an even faster escalation at present, on top of which overall geopolitical uncertainties are high. The possibility of a tail-risk currency crisis in the West should not be ignored in the same way as the risk of the current inflation crisis was.
Why are central banks buying gold?
In the first nine months of 2022, central banks bought more gold than they have ever bought during the first nine months of any other year. Central bank gold purchases reached a 55-year annual high just in the first nine months of 2022, with central banks buying more than 670 tonnes—worth over 37 billion dollars. The biggest buyers this year have been Turkey, Egypt, Uzbekistan, Irak, India, Qatar and the UAE.
Central banks have been net buyers of gold ever since the 2008 financial crisis, with most purchases coming from countries like China, Russia, Kazakhstan and Turkey. Also, over the past few years, European countries including Poland, Serbia, Hungary, and Ireland have also joined in on the gold purchases.
The World Gold Council performs recurring surveys for central bankers regarding their views on gold. Although not all central banks take part in the survey, it offers us a glimpse into the minds of some of these central bankers. In this year's survey (released in June 2022), fourteen central banks said that they are planning to buy more gold in the coming 12 months. Based on the survey, the top three reasons for buying gold were:
- Higher risk of a global financial crisis (11 replies)
- Anticipation of a structural change in the international monetary system (8 replies)
- Higher economic risks in reserve currency economies (8 replies)
Although the sample size is limited, these responses echo the findings which were discussed before. All of the above-mentioned reasons mirror the risk of a currency crisis in the West and so we could interpret that one of the reasons for the central bank gold purchases is the risk of a currency crisis in the West. The sanctions placed on the Russian central bank's foreign exchange reserves this year are also likely to be another factor when central banks in developing nations consider their reserve compositions as physical gold is proven to be very hard to sanction.
What is surprising is the return of the Chinese central bank as a buyer. In December, China reported the first addition to its official gold reserves since 2019. The official figures on China's gold reserves are prone to speculation as China has been notoriously untransparent regarding its gold purchases and total reserves. Some have even suggested that China's actual gold reserves could exceed the officially reported numbers by multiple times. Another factor to consider is that China's diversification away from US treasuries and into gold can be seen as political pressure against the US.
Market outlook for 2023
It is still very unlikely that we would see a currency crisis in the West in 2023, but the probability increases each year beyond 2023. On the other hand, it is very likely that we will see a recession both in the EU and in the US in 2023. In this chapter, we will explore what I see for 2023 and what it means for gold in particular.
Asking the right questions
Probably the number one question investors are asking is ”when will central banks pivot”, which in reality means ”when can I buy stocks again”. Rather than asking this question, investors should be asking “what asset allocation you should be in during a recession”. The central bank pivot is not one-on-one bullish news for high beta equities like tech stocks because 1) monetary policy acts with a lag, 2) the pivot will not stop the ongoing corporate earnings recession and 3) the pivot will not prevent the recession we are headed towards.
Historically, when central banks pivot from tightening to hold and later to easing often you'll see that in the following months from the first pivot stocks go down, the US dollar starts a topping process, gold goes up, and short-term treasuries rally.
As a reactionary actor, the Fed does not control asset prices—the rate of change in growth and inflation does. With these in mind, the Fed pivot in 2023 will most likely not cause stocks to rally immediately. On the other hand, gold will probably not perform as it did between March and November 2022 once the Fed pivots.
What drives the gold price
It is common to hear that gold performs well during an economic crisis. What you don't hear so much is that gold prices rose close to 300% from 2001 to 2008—during the biggest economic boom in recent history. Therefore, you should not think that crises would be the main drivers for gold price like some may claim—there are other factors in play.
In the short term, all asset classes including gold are driven by the developments in the macroeconomy. The rate of change in inflation and economic growth drives the trends in all asset classes. In the long term, gold prices are driven by the changes in the supply of money relative to the supply of gold.
Simply put, in the long term, if the amount of gold in circulation grows by 20% from mining production while the amount of euros in circulation grows by 300% from the ECB's money printer, the price of gold measured in euros rises by roughly 230% or in other words the price of euros measured in gold loses over 70%.
In the past, the ECB and the Fed have not been able to follow through with their QT attempts and nothing suggests that they would be able to do so this time around either. This gives us the bottom line assumption that the euros and US dollars in circulation will continue to increase instead of decrease, providing us with long-term bullish drivers for gold prices against both currencies.
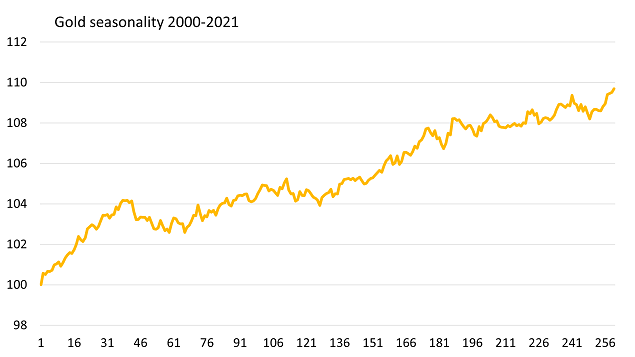
Gold's seasonality, fund flows, and cycles
In addition to favourable long-term drivers in place and a favourable short term macroeconomic environment, gold's seasonality is positive for the coming months. Gold tends to make major annual lows in either November or December after which gold is in the most bullish phase of the year until February or March. This has been the case 17 out of 22 times since 2000.
The beginning of the year is the most bullish season for gold
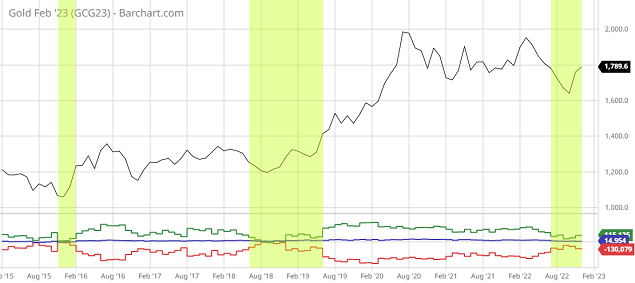
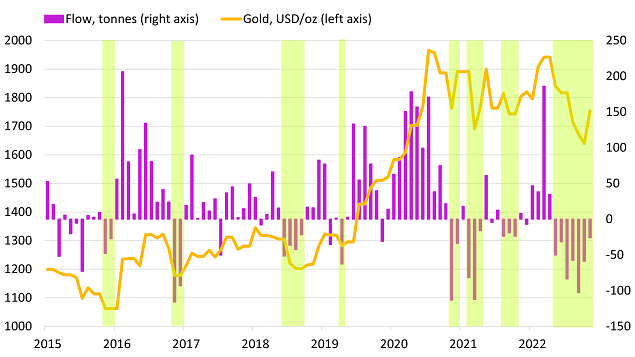
In addition to having seasonal tailwind, gold has been trading more or less sideways against the US dollar for more than two years after a sizable rally which lasted from 2018 to 2020. The bullish sentiment around gold has been fading during the consolidation, which shows up in the unenthusiastic positioning of the market, which is visible from the COT report data. The last time gold's COT report was this pessimistic was in May 2019, just before the multiyear gold rally took off. Gold ETF flows have also posted historic outflows this year, which showcases further pessimism often found at or close to major lows in gold.
The market is positioned in a similar way to prior major bottoms
Sizable ETF outflows often occur at or close to bottoms
Financial markets trade in cycles. The economic growth cycle is one of them, but the cycles are also visible in things like market positioning (COT reports) and volatility—periods of low volatility are followed by periods of high volatility and vice versa. Also, in the financial markets, when a rubber band (the price) is stretched downwards (stocks in 2008, gold in 2015, oil in 2020 etc.) it often snaps back up with similar momentum.
Gold has consolidated for the past two years and was stretched extremely far down in November after posting seven consecutive months of losses—most consecutive monthly declines in more than 50 years. It should also be mentioned that after a period of high volatility, gold's volatility has followed through with its bullish breakdown, as was discussed earlier this month—a bullish shift in volatility.
Forecast for gold in 2023
The macroenvironment, COT reports, ETF flows, seasonality, cycles and volatility are all bullish for gold. This does not mean that gold will go straight up from here but as we enter into the next year, the setup is very bullish.
Currently, and based on the reasons detailed in this report, I project that the price of gold will reach a high between 61,50 and 72,70 EUR/g in 2023. This means that I expect new all-time highs for gold measured in euros in 2023 and roughly 13–35% upside.
Risks for gold prices in 2023
You should always remain flexible when new data and information comes in and the above is based on what I see now. There are a couple of scenarios which could change my mind for my outlook for gold in 2023.
The first negative scenario for gold would be an extreme liquidity crisis, such as the Lehman Brothers' collapse in 2008, which would draw even more liquidity from the markets and could pull gold down together with other asset classes. The odds of such crises are definitely not zero for next year. However, often in such liquidity crises like the one in 2008 or the COVID panic in 2020, gold often reaches new highs faster than other asset classes, and so even though gold prices might initially fall in this scenario, gold often offers alpha during a liquidity crisis by falling less than other asset classes and recovering faster.
The second negative scenario would be rapid economic acceleration in which inflation would continue to fall, but at the same time the economies in the US and the EU would experience an unexpected boom. This will not be the case in the first half of 2023 but cannot be ruled out for the second half of 2023, as predicting economic data this far into the future is quite difficult. I consider this to be a very unlikely scenario for H1, but regarding H2 I remain open for new data which comes in during Q1 and Q2 of next year. The probability of this scenario materialising in H2, does not alter the bullish setup for H1 of 2023.
If something changes, I'll keep you posted through the Voima Markets newsletters and these market commentaries.
Happy holidays!
Disclaimer
The views expressed on this post are those of the author and do not necessarily reflect the official views or position of Voima.
You are allowed to copy our content, in whole or in part, provided that you give Voima proper credit and include the appropriate URL. The name Voima and a link to the original post must be included in your introduction. All other rights are reserved. Voima reserves the right to withdraw the permission to copy content for any or all websites at any time.
Nothing written in Voima's blog or website constitutes investment, legal, tax or other advice. It should not be used as the basis for any investment decision which a reader thereof may be considering. The purpose of Voima's blog is to provide insightful and educational commentary and is not intended to constitute an offer, solicitation or invitation for investing in or trading gold.