Gold in crises part 3: stagflation
Lasse Lindholm
Community Manager
Table of contents
Introduction
The term “stagflation” comes from the words “stagnation” and “inflation” and it refers to an economic environment in which economic growth is slow while inflation has been rising for some time. Stagflation is often associated with increased unemployment, but it is possible for there to be stagflation with a mixture of high employment and stunted economic growth.
Stagflation is an insidious economic crisis, since it causes the prices of consumer goods to rise as the economy is stagnating. Stagflation is usually connected with a demand or supply spike of a particular commodity in conjunction with a geopolitical crisis, which together weaken people's purchasing power.
A sudden increase in prices is commonly viewed as a threat in the eyes of the consumers, and it can cause inflationary psychology to spread and root within the populace. Inflationary psychology refers to a state of mind in which people and companies want to buy something cheaper now instead of buying something later for a more expensive price. Inflationary psychology amps up the demand, which in turn increases prices and realises the threat of inflation.
The danger of stagflation is born out of this fear caused by inflationary psychology and the cycles effected by this fear. The attempts of governments to control inflation by raising interest rates often lead to contracted economic growth, and if the economy contracts too much, stagflation will ensue.
The 70's stagflation and the Great Inflation
The Great Inflation, which led to stagflation, spanned almost two decades from 1965 to 1982. During this period, economists had to reconsider their thoughts and attitude towards the Fed and other central banks and their monetary policy. The period has been called 'the greatest failure of American macroeconomic policy in the postwar period'.1
First, let's take a look at which monetary policy decisions led the US to the Great Inflation in the 1970s. The root causes of the Great Inflation were the previous decisions taken by the Fed and the political decisions which made it possible for the supply of money to overflow.
After the Great Depression, the US began to create new regulations to prevent unemployment from reaching such severe levels ever again. In 1946, a new Employment Act was passed to ensure that everyone had a right to work and to hold purchasing power.
What made this Act problematic was that, back then, the views on the relationship between unemployment and inflation were erroneous. In the 1960s, it was thought that a low level of unemployment could be upheld when necessary by means of a moderately higher level of inflation. This idea was the result of a wrong interpretation of what is known as “the Phillips curve”. The Phillips curve is a theory based on an empirical experiment, according to which unemployment is inversely correlated with inflation in the short term. However, back in the 1960s, it was believed to have a similar correlation even in the long run.2
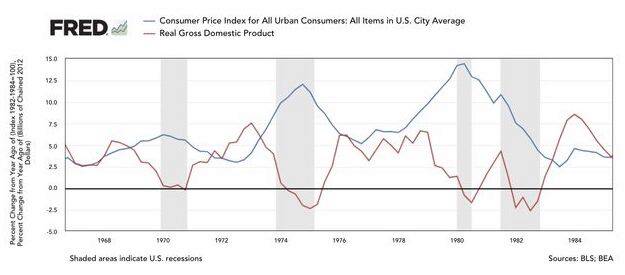
In the crisis that emerged in the 1970s, the world faced a new type of situation in which a combination of economic depression, mass unemployment and high inflation was brought to bear on the economies for almost two decades. This made the economists take a more critical look at their interpretation of Phillip's theory, and the conclusion was reached that unemployment and inflation did not have an inverse correlation in the long run (as can be seen from the graph below).
The Employment Act of 1946 mixed with the wrong interpretation of the Phillips curve led to a situation at the beginning of the 1960s, where the political guidelines of the Kennedy administration directed the Fed to check the interest hikes and conduct bad monetary policies in order to uphold full employment. In other words, they tried to maintain desirable levels of unemployment by allowing higher inflation, which eventually led the US economy to suffer from uncontrollable inflation.
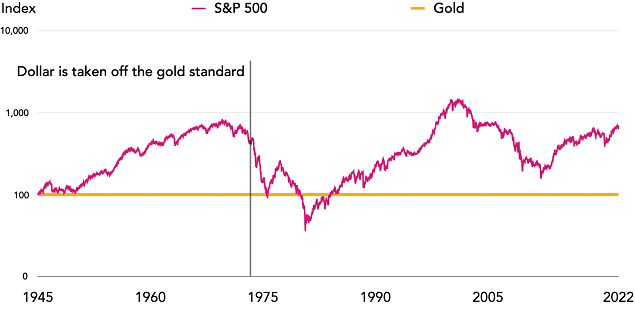
Another thing that led to the Great Inflation was the collapse of the Bretton Woods system in March 1971. The system was instituted in 1958, and it was supposed to act as a gold standard among its members: the member countries fixed their currencies to the US dollar, which in turn was fixed to gold so that 35 dollars amounted to one troy ounce of gold. Due to the internal policies and the employment goals of the US, foreign direct investments and loans issued to foreign investors were restricted. In 1968, the central banks stopped gold trades on the open markets.3 This changed the nature of the Bretton Woods system: the gold standard had now become a dollar standard. In the dollar standard, the other member countries of the Bretton Woods system had to allow their currencies to move in sync with the US dollar.3
As the US began its expansive and inflationary monetary policies in 1964, the inflation spread from the domestic situation into other Bretton Woods member countries as well. The collapse of the system in 1971 left the dollar and the rest of the currencies floating, meaning that the currencies had nothing to anchor themselves to. This is how the Great Inflation and the 70's stagflation is also related to the Bretton Woods collapse and the severing of the final ties between gold and the dollar.
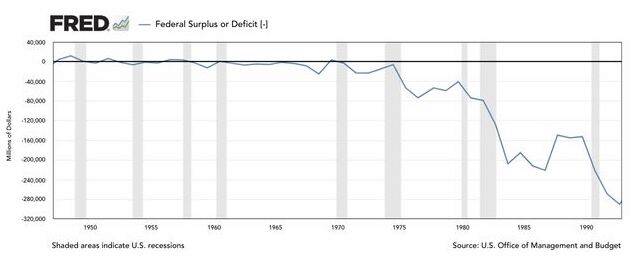
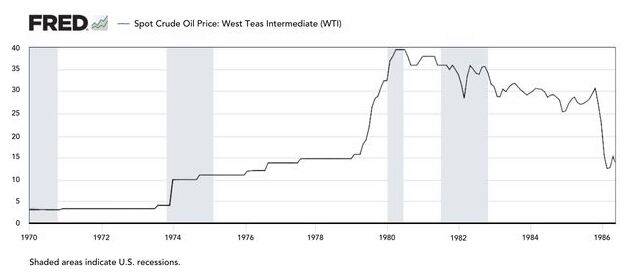
In addition to the political reasons outlined above, one of the general causes of the crisis was the high budgetary deficit of the US, shown in the graph below. The deficit was increased by the Vietnam War and the Arab oil embargo, which caused the price of oil to multiply. The peaking of the oil price led to the surprising rise of the prices of many products, and the results of this spread globally, thus constricting the global economy.
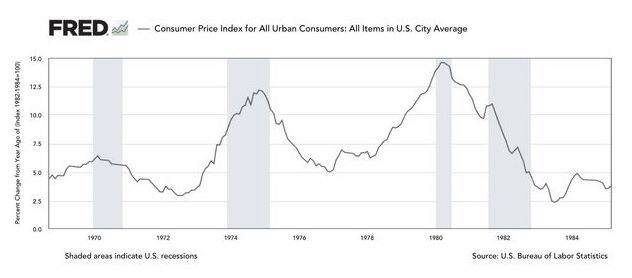
The general interpretation of inflation and unemployment at the beginning of the stagflation was erroneous, as discussed above. But it also affected the opinions of companies and households to the extent that they valued and even waited for the rising prices, until they found themselves in a horrible situation where inflation hit unbearably high figures. At the same time, unemployment rose and economic growth slowed down. The economy had entered stagflation. In 1964, the inflation was 1% and unemployment 5%, but ten years later inflation had reached 12% and unemployment 7%. In the summer of 1980, inflation was almost 14.5% and unemployment 7.5%.4
The unbearably high inflation and simultaneously rising unemployment posed a great challenge for the politicians. The aim of central banks and governments in such a situation is to react, but in a stagflationary environment they can no longer solve the problem: if they fight the high unemployment rate by lowering interest rates, this causes inflation to increase, and if they fight inflation by raising interest rates and changing the income policies, this causes unemployment to increase. Thus the US was left with an either–or, and they opted to bring inflation under control by hiking the rates and slowing down the growth of the money in circulation.
In July 1981, the US economy entered a recession that was both deep and persistent, lasting all the way up to November 1982. Unemployment rose to 11%, but at the same time inflation decreased, and as the recession came to an end, the inflation rate was below 5%.4
As people finally began to trust that the Fed would do its best to control inflation, the inflationary psychology began to wane and the unemployment rate began to decrease as the economy began to recover and level out.
Asset classes in stagflation
Stocks
A period of high inflation is typically preceded by a period of low inflation. This usually contributes to the fact that, especially at the beginning of high inflation, businesses are overvalued and often overpriced, as was stated in the article about the German hyperinflation.
Businesses and stock prices often suffer in stagflation, since on one hand the high growth of inflation and on the other the lack of income caused by unemployment change the consumers' consuming habits. Businesses often have to conform to this change at the same time as inflation causes their own expenses to increase. If the increased expenses cannot be covered, for example, through raising the product prices while retaining the customer base, this will reflect negatively on the business and, as a result, stock prices.
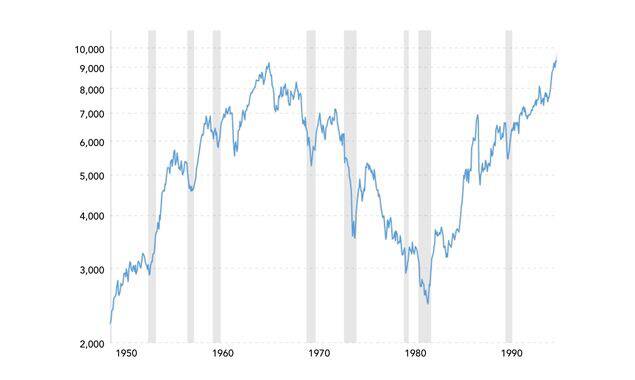
In the 1970s, stocks were overvalued in relation to their real returns (i.e. factoring in inflation). The value of the inflation-adjusted Dow Jones (that is, the effect of inflation has been added to the index values) dropped −65.5%5 from 7,157 points in November 1972 to 2,472 points in July 1982. During the same period, the inflation-adjusted S&P 500 dropped −61%6, while the gold-measured S&P 500 dropped −92% (see the graph below).
Bonds
Bonds tend to plummet during stagflation, since higher prices weaken the purchasing power of the currency that the investors are promised. These bonds lag behind inflation on a smaller scale than in the case of hyperinflation. When the inflation is factored in, the interest rates are often not enough to give investors profit, so in reality investors lose purchasing power through owning bonds during stagflation.
In 1964, inflation was 1%. Back then, bonds were still profitable, but in 1974 inflation had reached the threshold of 12% while the bonds' interest rates were only about 7–8%. In the summer of 1980, inflation was almost 14.5%, and the bond rates were 11%. The table below shows that bonds were not profitable when inflation was taken into account.
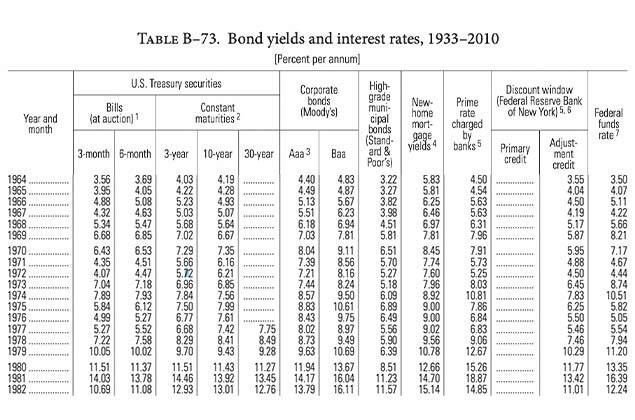
Here is a demonstration: An investor invests $1,000 into a 10-year bond in 1970. This means that the government is lent $1,000 for a ten-year period, and the government will pay a yearly interest of 7.35% for this. Thus the lent capital would return an annual yield of $73.50 for a decade.
However, during this period, inflation was roughly 8.5% on average in the US. Since the purchasing power of the dollar weakened by 8.5% a year, the $1,000 capital invested in the bond only had $150 worth of purchasing power left after the bond's maturity. Even if the investor had had $1,735 at the beginning of 1980, the purchasing power of these dollars would have only been $260. In other words, even if the investor had more dollars at the end of the day, their value crashed by over 80%.
Housing
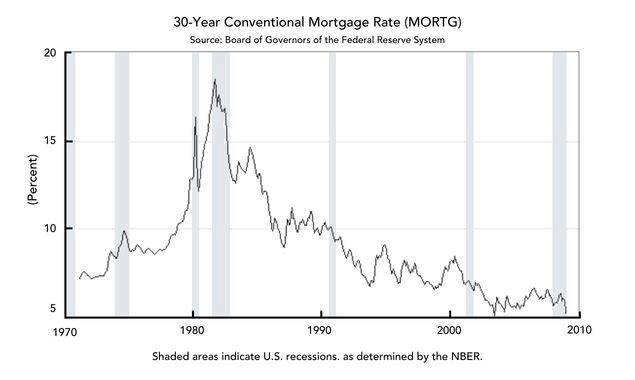
In order to control the inflation in the 1970s, the economy had to be halted and the interest rates had to be raised by as much as 19%.7 During 1978–1981, the housing sales in the US dropped by −50 %, from 3,986 million to 1,990 million. The issuance of new sales and building permits dropped in the same proportion. The share of unemployed construction workers in 1979 was 7%8 while in October 1982 it was 22.6%9. Simply put: the housing market crashed when the mortgage rates rose close to 20%. In this kind of an environment, liabilities must be repaid with money that is worth more than the money lent, meaning that the price of mortgages goes up.
As the rates go up, the number of granted mortgages goes down, which causes the housing prices to dive down. Simultaneously, high inflation raises the prices of running costs and debt servicing. The rents, however, remain low. All this made housing an unprofitable investment in the stagflationary environment.
Generally, a period of high inflation is not a bad time to hold a mortgage, since inflation makes the repayment faster. Owning a house through a mortgage was thus not a bad choice during inflation as long as the mortgage was protected against rising interest rates.
The general price level of housing rose in 1970 if measured in dollars, but it is worth noting that at the same time, the purchasing power of the dollar decreased at an annual average of 8.5% throughout the decade. If the house prices from that period are measured in gold, the prices decreased considerably throughout the decade (see the home price development graph below).
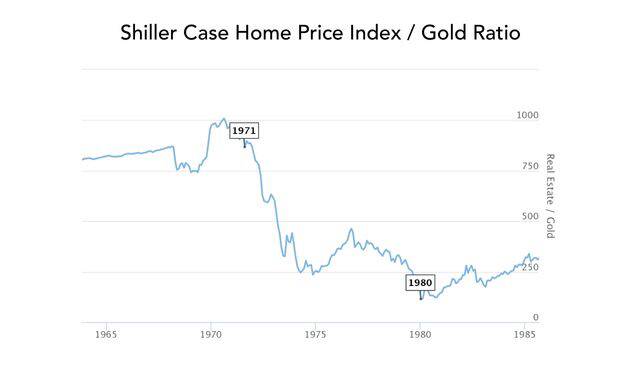
Housing lost its purchasing power almost eightfold compared to gold.
Gold
Many asset classes took a hit whereas gold retained its purchasing power much in the same way as it did during the hyperinflation. Gold is a supranational currency and it is not affected by local crises: gold retained its value also during the 1970's stagflation, and its relative purchasing power stayed the same or even increased.
It is important to note that the gold market can be subject to temporary shocks that come and go. This is why one must follow the long-term trends and price development.
Let's take a look at a similar demonstration with gold as was given in the section on bonds: with the same $1,000, the investor now decides to invest in gold instead of bonds, and sells his gold after 10 years have passed.
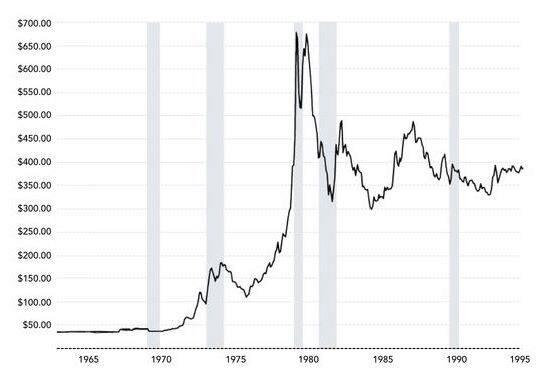
The price of gold in January 1970 was $36.56 per ounce, so with $1,000 the investor gets 27.35 ounces of gold. In January 1980, the gold is sold for $677.97 per ounce, which amounts to 18,542.48 dollars. When the original $1,000 is subtracted from this, the investor gets a total profit of 17,542.48 dollars.
Gold could retain its purchasing power during the inflation, and a potential investor could have got $17,542.48 in profit with it (cf. the $735 in the case of bonds). This is why gold is known as the safe haven during inflation and an economic recession.
Summary
The Great Inflation and the stagflation caused by it took place in 1965–1982, and this period has been described as the greatest failure of American macroeconomic policy in the postwar period. The crisis was a mixture of depression, mass unemployment and high inflation, which were caused for example by the budgetary deficit of the US and the belief of the US government and central bank that inflation and unemployment were inversely correlated. The latter, erroneous interpretation led the US to adopt measures whereby they tried to make use of moderately higher inflation to increase the employment figures; however, this got out of hand and eventually caused a stagflation.
The inflation was made worse by the high budgetary deficit of the US, which was increased by the Vietnam War and the Arab oil embargo, which caused the price of oil to rocket. This increased the prices of many other products. In addition to this, the dollar standard created by the Bretton Woods system made it possible for the internal problems of the US to be reflected in the other member countries of the BW system.
With the exception of gold, many other asset classes were badly off during the stagflation. During the 1970s, the inflation-adjusted Dow Jones dropped by −65.5%. The interest rates of bonds could not catch up with inflation; for example, in 1980 inflation was 14.5% while the bond rate was 11%. To cap it all, the number of sold houses dropped by half during 1978–1981. If these asset classes are measured in gold, the stocks lost −92%, bonds −91% and housing −88% of their value from January 1970 to January 1980.10
The ownership of gold made it possible for a person to rise to a whole new level in living standards. By acquiring gold, certain people could move a whole category up in their wealth class. This is worth keeping in mind, when one considers the future.
The views expressed on this post are those of the author and do not necessarily reflect the official views or position of Voima.
You are allowed to copy our content, in whole or in part, provided that you give Voima proper credit and include the appropriate URL. The name Voima and a link to the original post must be included in your introduction. All other rights are reserved. Voima reserves the right to withdraw the permission to copy content for any or all websites at any time.
Nothing written in Voima's blog or website constitutes investment, legal, tax or other advice. It should not be used as the basis for any investment decision which a reader thereof may be considering. The purpose of Voima's blog is to provide insightful and educational commentary and is not intended to constitute an offer, solicitation or invitation for investing in or trading gold.
-
Jeremy Siegel et al. 'Issues for Debate in Social Policy: Selections From CQ Researcher,' Page 408, Sage Publications, 2019. ↩
-
https://www.federalreservehistory.org/essays/great-inflation ↩
-
https://www.macrotrends.net/1319/dow-jones-100-year-historical-chart ↩
-
https://www.macrotrends.net/2324/sp-500-historical-chart-data ↩
-
https://www.npr.org/2022/09/29/1125462240/inflation-1970s-volcker-nixon-carter-interest-rates-fed ↩
-
https://www.huduser.gov/periodicals/ushmc/fall08/hist_data.pdf ↩
-
The historical gold prices have been retrieved from Bloomberg. ↩