Voima Markets Newsletter—October 2023
Sam Laakso
Head of Voima Markets
Currency market table
| Gold price in | September | 3M | 1Y | 3Y | 5Y | 10Y | 20Y |
|---|---|---|---|---|---|---|---|
| GBP | −0.99% | 0.29% | 1.90% | 3.77% | 65.61% | 84.76% | 553.24% |
| CHF | −1.28% | −1.60% | 3.25% | −2.59% | 44.52% | 40.85% | 232.58% |
| JPY | −2.21% | −0.36% | 14.91% | 38.84% | 103.77% | 111.82% | 542.75% |
| EUR | −2.27% | −0.62% | 3.24% | 8.64% | 70.26% | 78.15% | 429.04% |
| AUD | −3.98% | −0.24% | 10.85% | 9.08% | 74.19% | 101.54% | 407.21% |
| CAD | −4.22% | −1.23% | 9.36% | −0.07% | 63.19% | 83.46% | 381.50% |
| NOK | −4.25% | −4.01% | 9.33% | 12.25% | 103.43% | 147.58% | 627.75% |
| USD | −4.71% | −3.71% | 11.37% | −1.97% | 55.10% | 39.29% | 379.77% |
| SEK | −4.96% | −2.45% | 9.89% | 19.55% | 90.57% | 136.68% | 575.86% |
Top news in the markets recently
Credit card losses are rising at the fastest pace since the Great Financial Crisis (CNBC)
U.S. national debt tops $33 trillion for first time (New York Times)
Inflation worries fuel Japanese rush to buy gold (Financial Times)
Trader's comment 13 October 2023
Let's start this month's newsletter with a brief look at some economic indicators.
Economic outlook
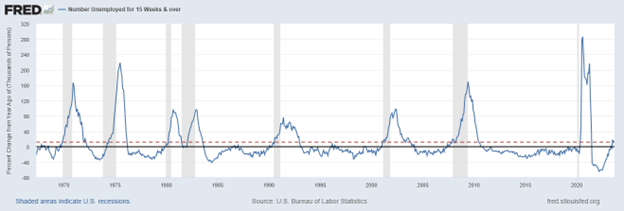
The US job market has been showing signs of deterioration. Although unemployment is still historically low in the US, unemployment is a lagging indicator of economic activity because most often companies do not fire people when business is booming but rather when business is already weak. A good indicator of overall health of the job market is long-term unemployment, which does not fluctuate as much as short-term unemployment. The US long term unemployment (people unemployed for 15 weeks or more) is now growing at a rate of 15% year over year (YoY). Coming from falling long-term unemployment to growing unemployment at 15% YoY has always preceded a recession in the US over the past 50 years.
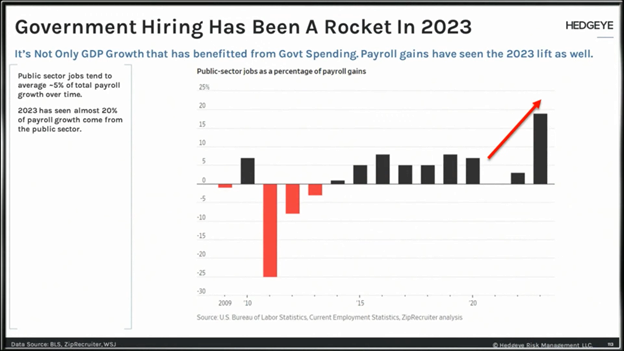
In addition, the US job market may not have been as strong this year as has been widely considered. The public sector's share of jobs gained in the US has been close to 20% this year compared to an average of ~5%, as was well illustrated by Hedgeye in the chart below.
While the growing long-term unemployment has not made it to the headlines (yet), markets have been buzzing about the US yield curve, which is steepening from historically inverted levels. A steepening yield curve has also been a great predictor of US recessions in the past.
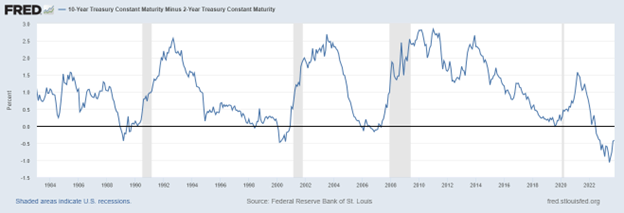
The steepening of the yield curve and the rise of long-term unemployment are typical late-cycle indicators, suggesting that the US economy is about to enter a recession. Historically, the yield curve tends to steepen before the job market deteriorates, but considering the public sector's role in this year's jobs gained and the already rising long-term unemployment, this may not be the case this time and a recession in the US could be closer than expected. The yield curve suggests that a recession in the US is still about 12 months away but the job market, which tends to be the last indicator to move prior to a recession, suggests that a recession may come already in the first half of 2024. Be it either way, the odds of the US heading into a recession over the next 12 months are high.
Meanwhile, the eurozone has taken a head start towards recession, as Germany slipped into a recession in Q2, with Ireland, the Netherlands and Austria recording negative growth in the same quarter. It seems that this economic reality is not fully priced in European or US equities, and so there is substantial risk to the downside.
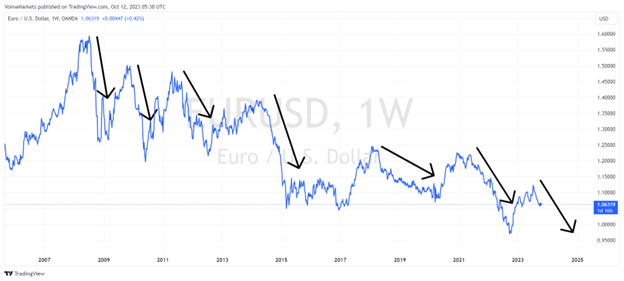
The weakness of the European economies is also showing on the EUR/USD exchange rate as the dollar has been strengthening against the euro for the past three months. The trend of higher highs and higher lows for the EUR/USD in 2023 has been broken and, although over the next few weeks the euro is likely to bounce, the overall direction for the euro is down. We'll probably start seeing a trend of lower highs and lower lows for the euro. It is good to keep in mind that currencies, being the largest markets in the world, tend to trend in one direction for long periods of time. The bigger trend for the euro started already after the financial crisis of 2008.
Real estate
Real estate will probably play an increasing role in the headlines over the coming year. We addressed the liquidity issues with international real estate funds already in the April newsletter as news from the UK and the US started to come in. Back then, multibillion dollar funds like BREIT were limiting withdrawals and we noted that “Generally speaking, it is probably not a bad idea to limit exposure towards real estate as a whole”.
To give a local touch to this newsletter, in September, the second largest real estate fund in Finland freezed redemptions, since they were unable to meet redemption requests as investors wanted to liquidate 14% of the fund's total assets in one month. Many of the largest Finnish real estate funds have been making changes to their terms and conditions lately. Most of the changes have been about making the funds less liquid by limiting sales of the funds from every four months to every six months or limiting sales so that if investors want to sell e.g. 5% of the fund's total value, the fund may refuse to pay the sellers.
Real estate markets across the globe are frozen still as interest rates have been raised historically quickly. A recession is often not the best jump starter for real estate, rather the situation is likely to get worse.
Gold
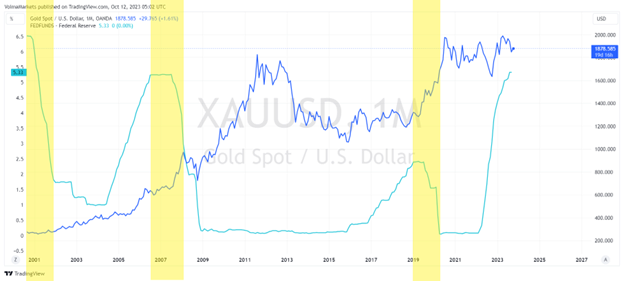
Gold prices took a dive in the last week of September. This coincided with a spike in the US 10-year bond yields, which—for those new to the topic—has been very tightly inversely correlated with gold for the past two decades. As US bond yields rise, gold falls, and this has been the main driver for the decline in gold over the past month. Both the Fed and the ECB are probably done with rate hikes, and historically the pause on rate hikes and the initial rate cuts have been good periods for gold.
In addition to a bullish-for-gold interest rate environment, the sentiment around gold is very negative, which tends to correlate with larger bottoms. A similar setup was discussed in the November 2022 newsletter, which coincided with the previous major bottom. Today, the situation has a historical resemblance, and so let's compare the current setup in gold to the setup in 2018–2019.
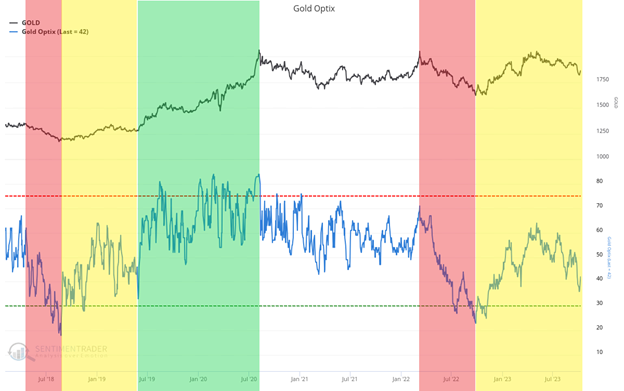
In 2018, the gold price fell for six continuous months—the longest streak since the 1970s, causing the sentiment in gold to fall to its lowest level in almost two decades (first red zone of the picture above). In late 2022, gold price fell for seven continuous months—another record-breaking decline which severed the sentiment (second red zone).
After the bottom in August 2018, gold prices rallied for six months, rising by 15% after which gold corrected for three months and sentiment declined again (first yellow zone). After the bottom in November 2022, gold prices rallied for seven months, rising by 28% after which gold has now corrected for five months, and sentiment has fallen again (second yellow zone).
Once the correction in 2019 was completed, gold rallied for two years straight in its most recent leg up in the current secular bull market in gold (first green zone). Gold remains in a secular multidecade bull market and, having been in a more-or-less sideways consolidation for three years, the market has forgotten gold's existence and is looking elsewhere, just like at the beginning of 2019.
Right now, gold is likely in the bottoming phase of this intermediate decline and is likely to find a bottom in the coming weeks, unless the price bottomed already on 6 October. The correction has served its purpose—getting everyone bearish on gold, which will be the fuel for the next leg up in gold's secular bull markets.
Shanghai–London gold price difference
Premiums eased temporarily in September as news about China would potentially loosen import restrictions, but now they have risen again in recent days. The fundamentals addressed in the September newsletter still apply, and once import restrictions loosen, the premiums in Shanghai are very likely to converge with the Western gold prices. Nothing new under the sun.
Disclaimer
The views expressed on this post are those of the author and do not necessarily reflect the official views or position of Voima.
You are allowed to copy our content, in whole or in part, provided that you give Voima proper credit and include the appropriate URL. The name Voima and a link to the original post must be included in your introduction. All other rights are reserved. Voima reserves the right to withdraw the permission to copy content for any or all websites at any time.
Nothing written in Voima's blog or website constitutes investment, legal, tax or other advice. It should not be used as the basis for any investment decision which a reader thereof may be considering. The purpose of Voima's blog is to provide insightful and educational commentary and is not intended to constitute an offer, solicitation or invitation for investing in or trading gold.